Assumptions of Chi-Square test
In this section, we are going to learn the Assumptions of Chi-square test. In SPSS, there are two major assumptions of the Pearson chi-square test.
The first one is individual observation should be independent of each other. Suppose we get the data in the format of frequencies, and we categorize our data in the format of a contingency table. The contingency table is as follow:

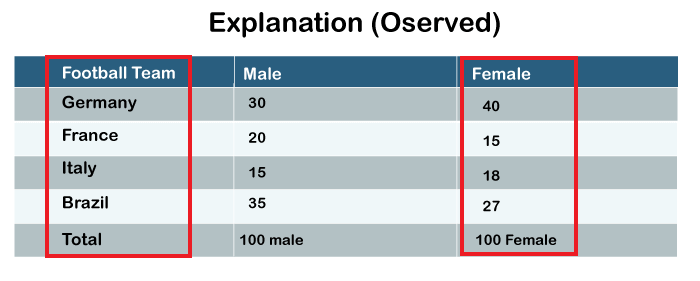
So this is the table that we have created for the demonstration purpose. Now, look at the values written in each cell of this table. This table is basically about measuring the popularity of football game between males and females. The researcher has randomly taken 100 male football fans and 100 female football fans. He will ask them which is their most favorite team. We can see 30 males voted for Germany, 20 for France, 15 for Italy and 35 for Brazil.
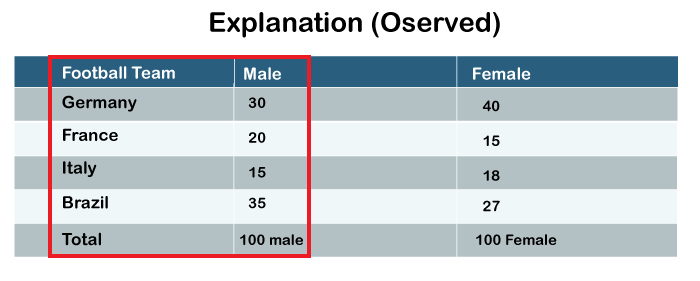
In the female category, 40 females voted for Germany, 15 for France, 18 for Italy and 27 for Brazil.
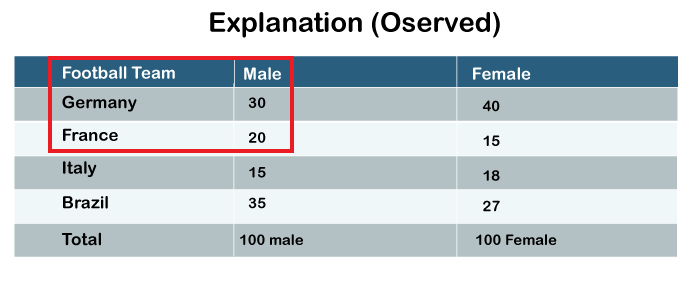
Now the observation 30 males for Germany and 29 males for France, they must be independent of each other. That is the meaning of first assumption. The selection of the 30 males in the first category does not affect selecting these 20 males in the second category and so on. So the first assumption of the Chi-square test is that individual observations are independent of each other.
The second important assumption of chi-square is that the expected cell frequencies should not be too small. In fact, if there are atleast five frequencies or observations in each expected cell, then we consider our data sufficient for chi-square testing. We will go back to our example data set.
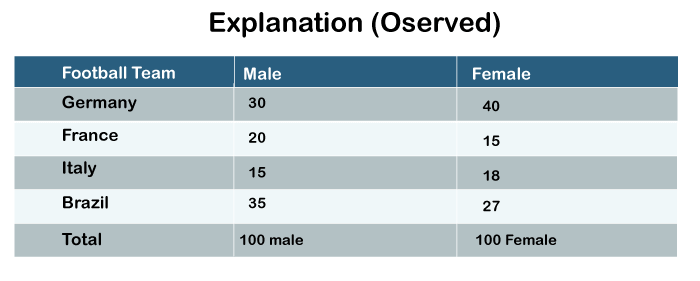
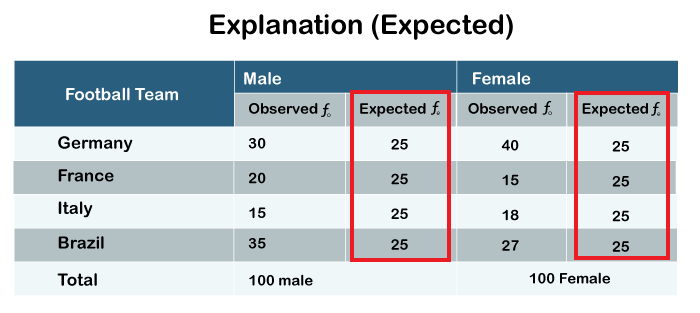
So these are the actual observed frequencies. When a researcher conducted research, these are the actual individual who voted in favor of different teams. The expectation is that there must be an equal number of voters for each football team. So if we are having a total of 100 males and 4 teams, we expect that there would be 20 male subjects per team. That means 20 male football fans in favor of each team, and similarly for the females. So these actual observations are different, but we expect them to be similar across all the categories. So the table can be redrawn in such a way that we can show expected and observed frequencies. Look at the redrawn table:
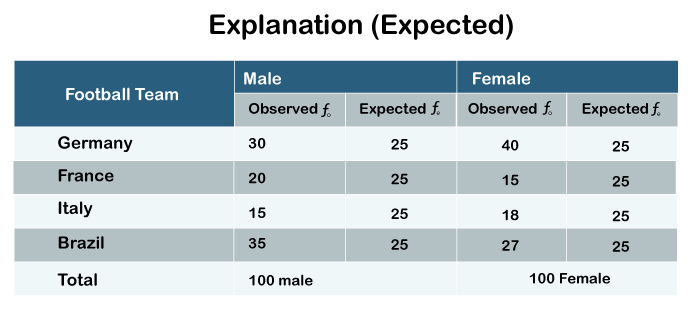
In the table, we have recreated expected frequencies as well. If we have 100 subjects in the male category and 100 subjects in the female category, we expect 25 subjects in each of the four cells. That means 25 male subjects and 25 females are favoring each of the four football teams. So observed frequencies and expected frequencies both are different from each other. Expected frequencies can be derived by finding out the total number of observations and dividing it by the number of categories. In our case, the number of categories is 4. That means there are four teams. If we divide 100 by 4, we will get 25 each for the expected frequency for males and females. The chi-square test is nothing but a test of the difference between observed and expected frequencies.
Formula for Chi-square test
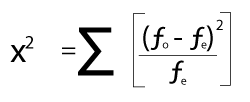
The formula of chi-square test is used for the calculation. The formula is as follows:
Where
fo stands for the observed frequency
fe stands for the expected frequency.
In the denominator, we again have the expected frequency. So when we calculate the chi-square, we take the observed frequencies and the expected frequencies. We deduct expected from the observed, and we square it. The result of square will be divided by the expected frequency. So the calculation of the above table would be like:
(30-25)2 / 25 + (20-25)2 / 25 + (15-25)2 / 25 + (35-25)2 / 25
So while using the chi-square formula in a simple way, we can find out the significant differences between groups. In the next section, we will learn how to enter this data in SPSS and how to perform a chi-square test and interpret the result.