Calculation of Chi-square test
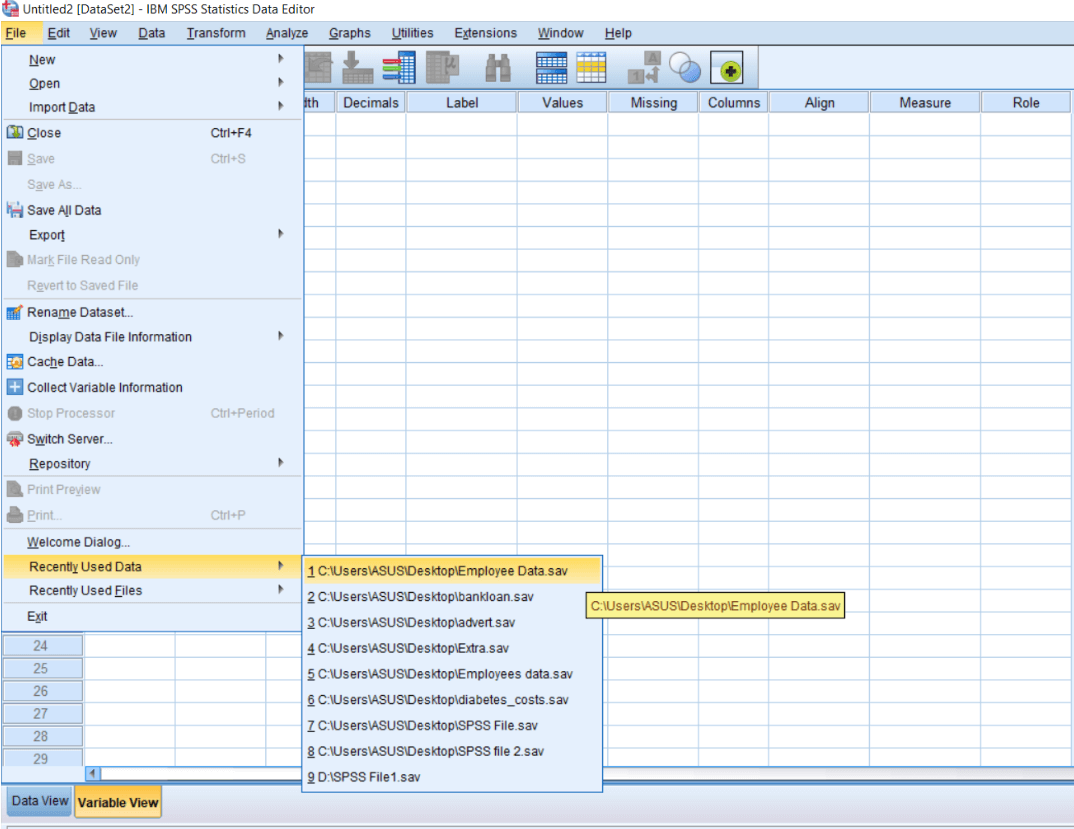
In this section, we will learn how to calculate the chi-square test in SPSS. To calculate the chi-square test, we will open our Data set by going to the File menu, then go to Recently used Data as follows:
Now we will click on the above Employee Data option and see our Employee Data set as follows:
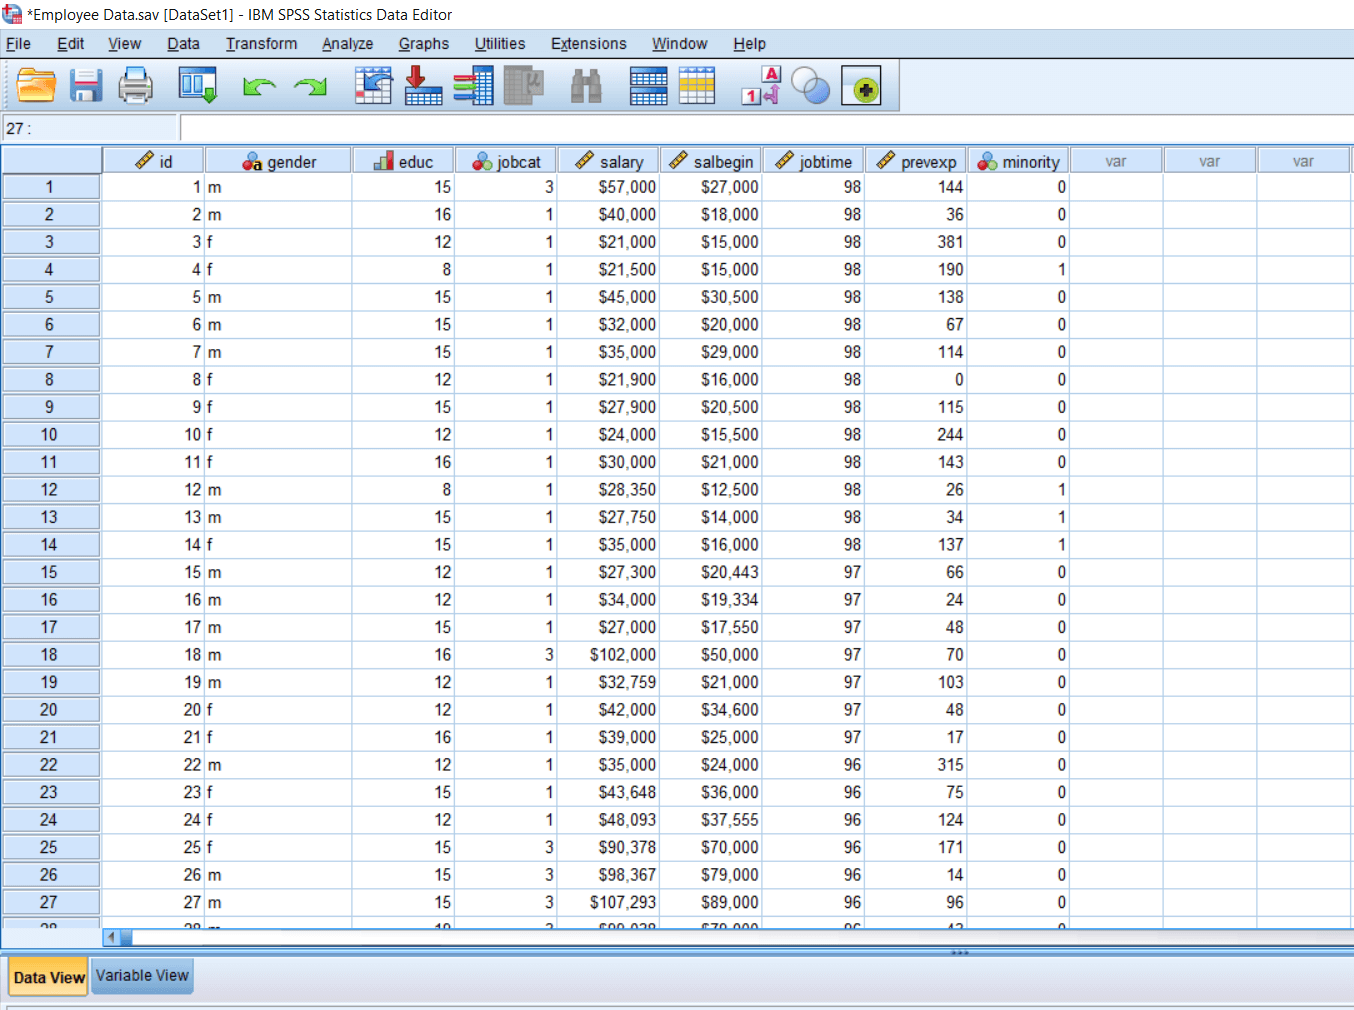
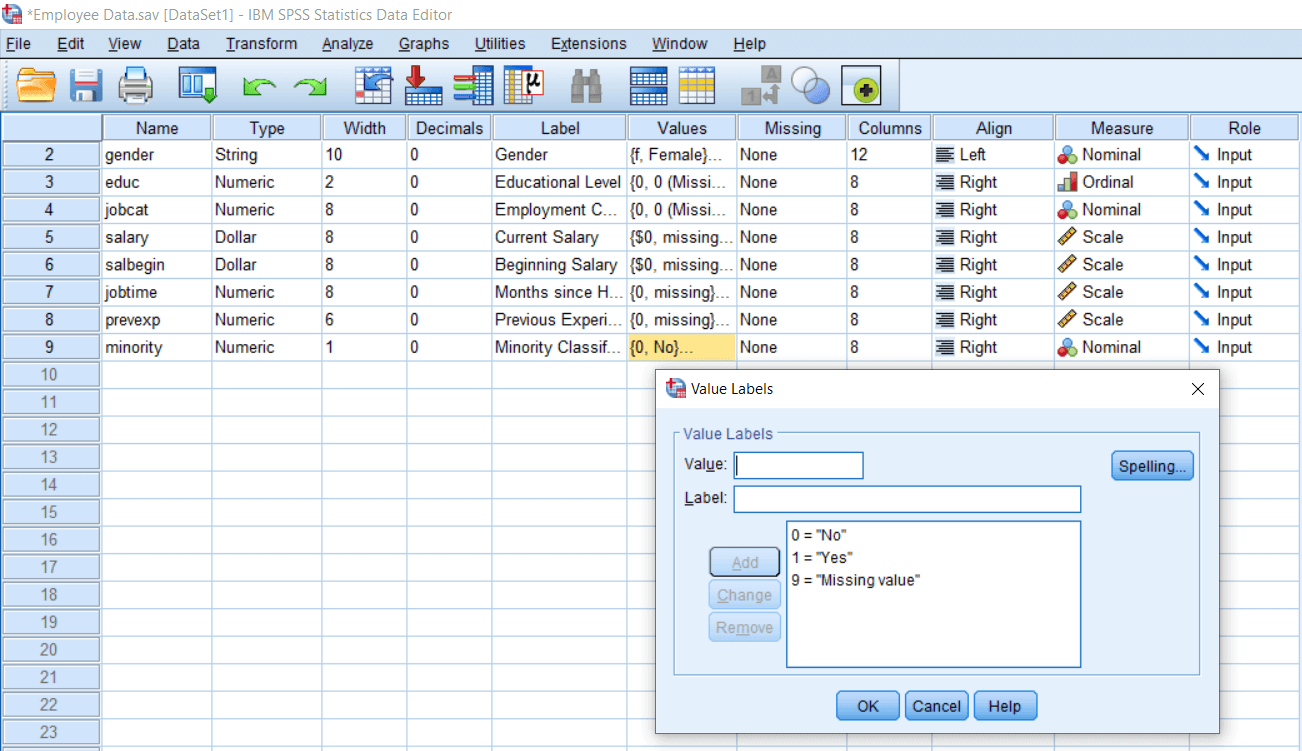
Look at this data set. In this data set, we have the recode of various employees with their ID, gender of the employee, education, job category, current salary, beginning salary, job time, previous experience and minority classification. In gender, m stands for males and f stands for females. In minority classification, 0 means No, which shows the person is not from a minority background, and 1 means Yes, which shows the person belongs to the minority background. 9 is for the missing value.
Using this data set, we want to test if there is a significantly higher number of males as compared to females from minority communities. So the researcher is currently interested in the gender variable and its relationship with the minority classification.
The question could be whether there is a significant difference between the number of males and females belonging to the minority classification. So, in this case, we will use the chi-square test. We will use the chi-square test because both variables, gender and minority classification are nominal variables or frequency variables. They are frequency variable, so any other parameter stats like t-test cannot be applied. The question is, should we consider one variable as an independent variable and another variable as a dependent variable while calculating chi-square. The answer is yes. Yes, we can select a variable as an independent variable. We can see whether it impacts the dependent variable significantly by using the Crosstab option.
But all in all, while calculating the chi-square test, IBM SPSS does not make a distinction between the independent and dependent variables. It calculates an interaction between the two frequency variables that we choose and derive inference based on our interpretation. So before moving into that, let us see how we can calculate the chi-square test. So we can calculate the chi-square test in many ways. For example, we can calculate the chi-square test using Descriptive statistics and the Crosstabs option that we are going to use currently.
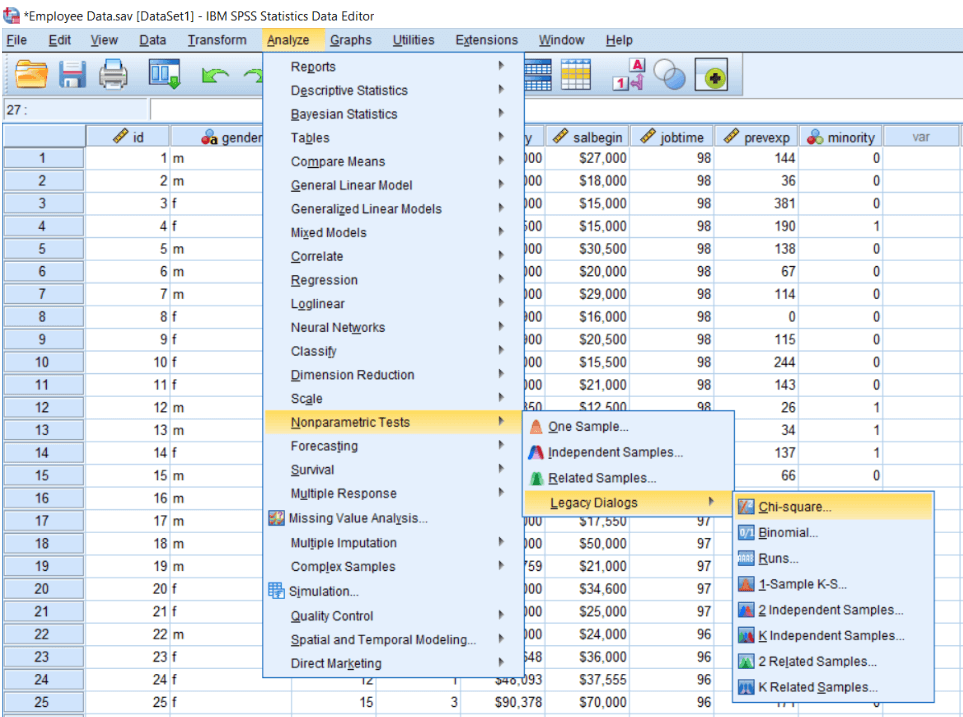
Alternatively, since we know, chi-square is a non-parametric test. So we can also calculate the chi-square test by going to Non-parametric tests, and then we can go to Legacy Dialogs, and then we can calculate the Chi-square test.
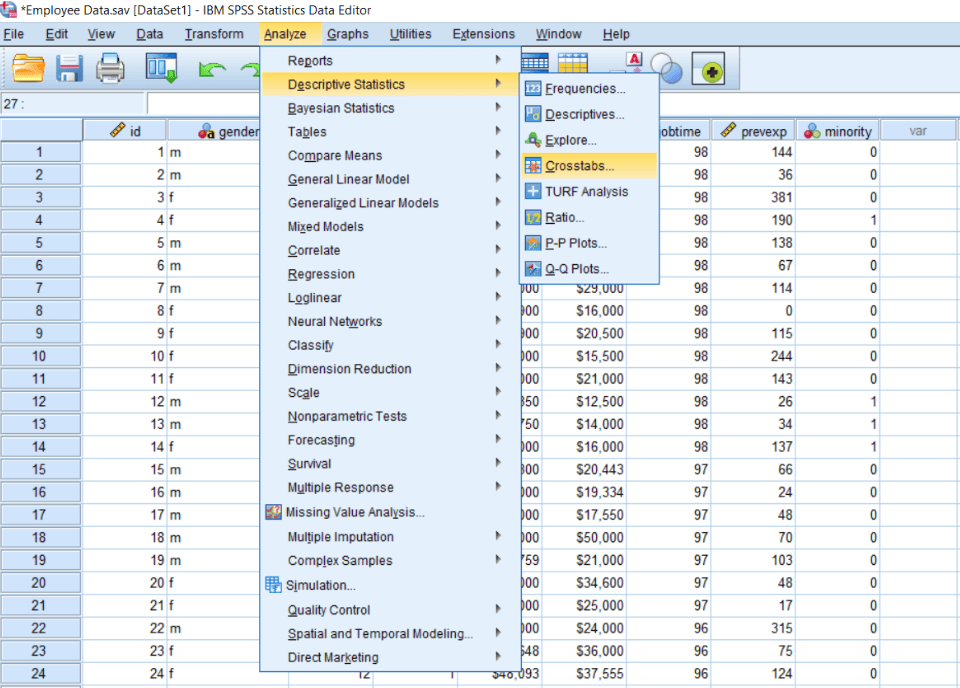
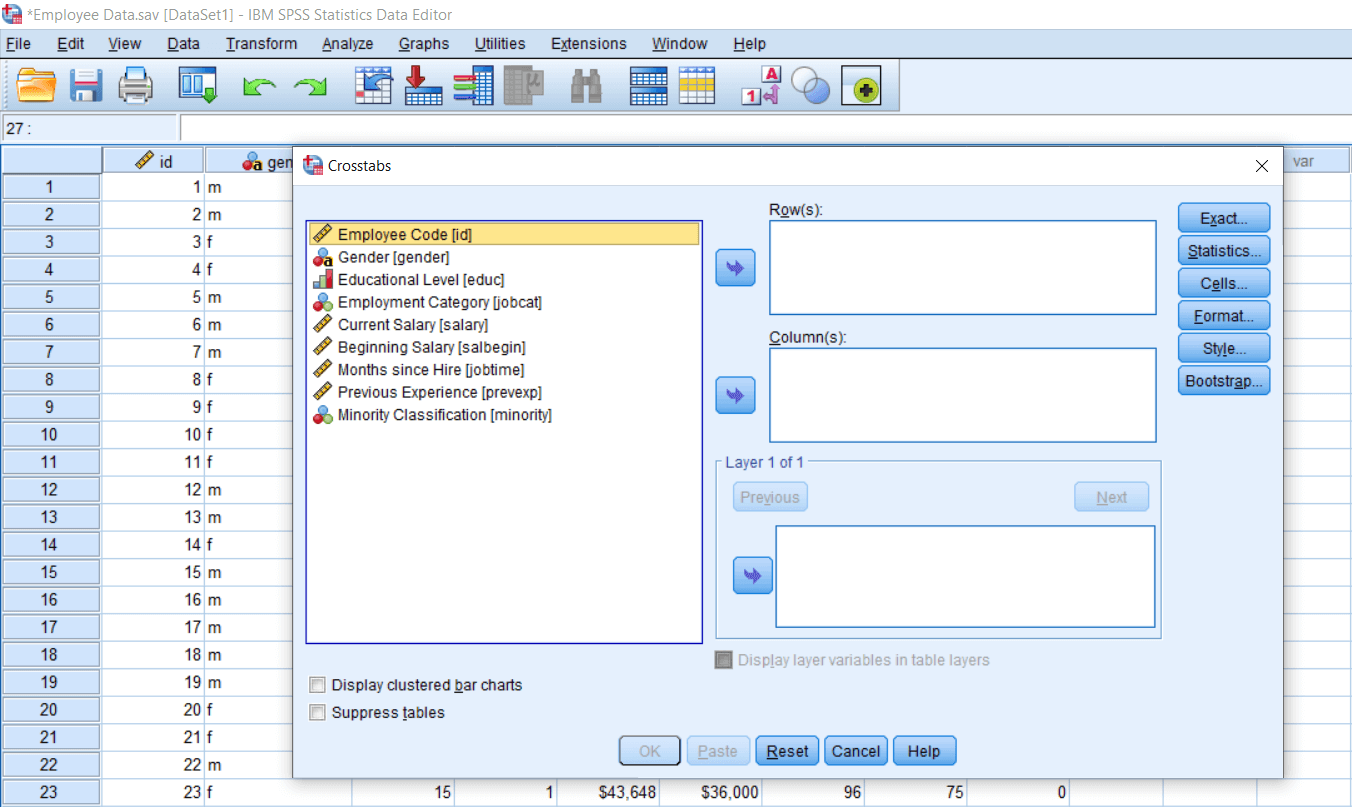
So currently, we are going to demonstrate a chi-square test using the Crosstab option. To calculate chi-square using cross tab options, we will go to Descriptive statistics and then go to crosstabs. After clicking on the crosstab option, we can see all our variables populated like this:
Now we want to see whether males and females are significantly different in number in reference to their minority classification. So we will take gender as an independent variable for all practical purposes in this study. So if we want to take a variable as an independent variable, we can take it in a column dialog box. So we will take gender in our column dialog box.
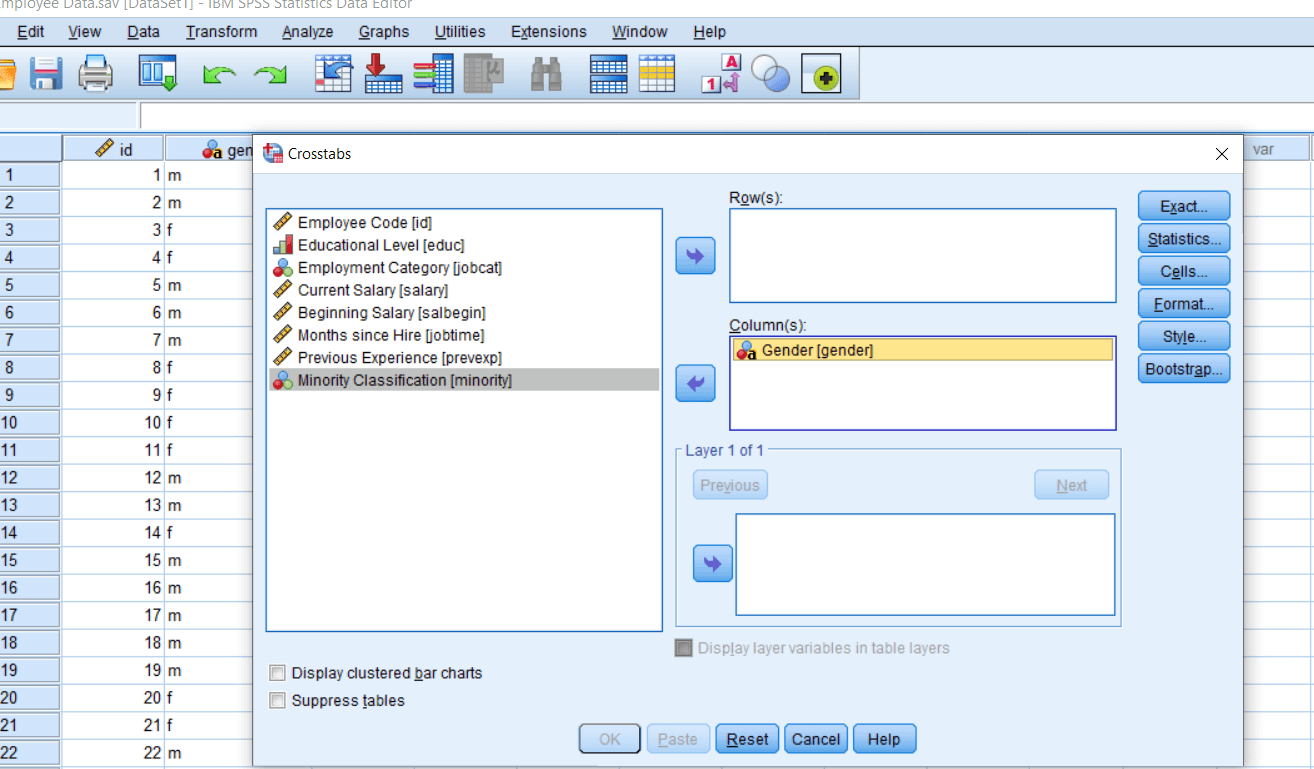
Our dependent variable is minority classification. So take minority classification in our row dialog box. But practically it’s going to make no difference in the result either we choose gender in a column dialog box or row dialog box or visa versa. It’s only going to tell us the interaction between frequencies.
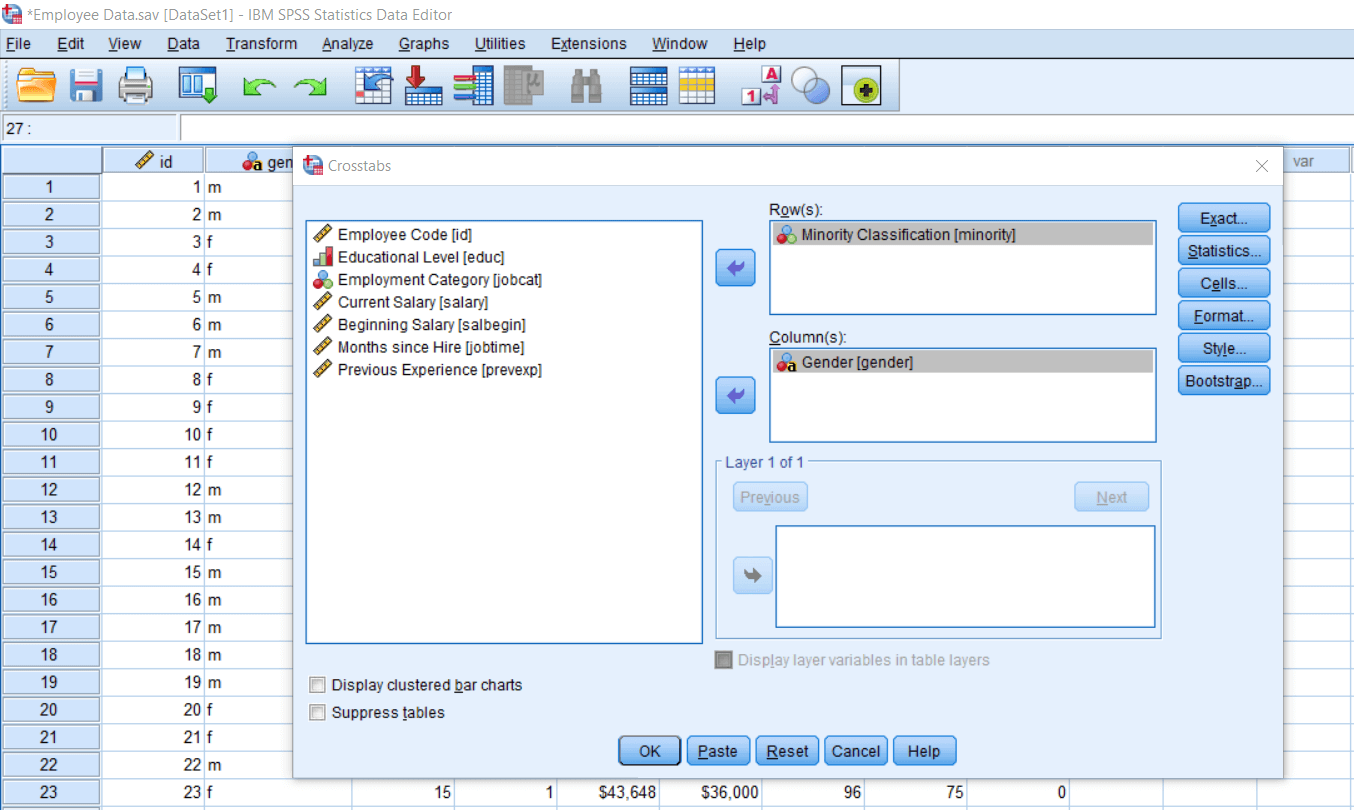
Note: Chi-square is just a test of association, and it does not matter whether we are taking our independent variables in row or column. But as a convention, if we hypothesize an independent variable, then take it in the column. The dependent variable will be taken in a row.