Cause and Effect Graph in Black box Testing
Cause-effect graph comes under the black box testing technique which underlines the relationship between a given result and all the factors affecting the result. It is used to write dynamic test cases.
The dynamic test cases are used when code works dynamically based on user input. For example, while using email account, on entering valid email, the system accepts it but, when you enter invalid email, it throws an error message. In this technique, the input conditions are assigned with causes and the result of these input conditions with effects.
Cause-Effect graph technique is based on a collection of requirements and used to determine minimum possible test cases which can cover a maximum test area of the software.
The main advantage of cause-effect graph testing is, it reduces the time of test execution and cost.
This technique aims to reduce the number of test cases but still covers all necessary test cases with maximum coverage to achieve the desired application quality.
Cause-Effect graph technique converts the requirements specification into a logical relationship between the input and output conditions by using logical operators like AND, OR and NOT.
Notations used in the Cause-Effect Graph
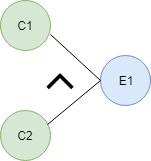
AND – E1 is an effect and C1 and C2 are the causes. If both C1 and C2 are true, then effect E1 will be true.
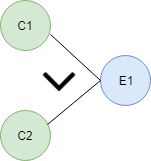
OR – If any cause from C1 and C2 is true, then effect E1 will be true.
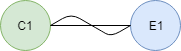
NOT – If cause C1 is false, then effect E1 will be true.
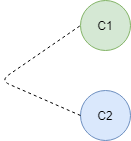
Mutually Exclusive – When only one cause is true.
Let’s try to understand this technique with some examples:
Situation:
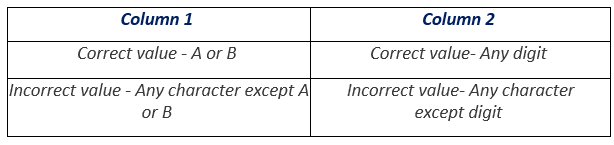
The character in column 1 should be either A or B and in the column 2 should be a digit. If both columns contain appropriate values then update is made. If the input of column 1 is incorrect, i.e. neither A nor B, then message X will be displayed. If the input in column 2 is incorrect, i.e. input is not a digit, then message Y will be displayed.
- A file must be updated, if the character in the first column is either “A” or “B” and in the second column it should be a digit.
- If the value in the first column is incorrect (the character is neither A nor B) then massage X will be displayed.
- If the value in the second column is incorrect (the character is not a digit) then massage Y will be displayed.
Now, we are going to make a Cause-Effect graph for the above situation:
Causes are:
- C1 – Character in column 1 is A
- C2 – Character in column 1 is B
- C3 – Character in column 2 is digit!
Effects:
- E1 – Update made (C1 OR C2) AND C3
- E2 – Displays Massage X (NOT C1 AND NOT C2)
- E3 – Displays Massage Y (NOT C3)
Where AND, OR, NOT are the logical gates.
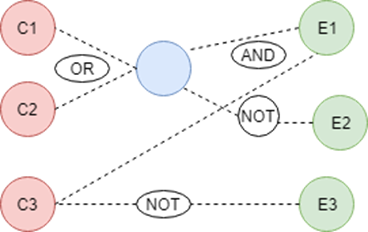
Effect E1- Update made- The logic for the existence of effect E1 is “(C1 OR C2) AND C3“. For C1 OR C2, any one from C1 and C2 should be true. For logic AND C3 (Character in column 2 should be a digit), C3 must be true. In other words, for the existence of effect E1 (Update made) any one from C1 and C2 but the C3 must be true. We can see in graph cause C1 and C2 are connected through OR logic and effect E1 is connected with AND logic.
Effect E2 – Displays Massage X – The logic for the existence of effect E2 is “NOT C1 AND NOT C2” that means both C1 (Character in column 1 should be A) and C2 (Character in column 1 should be B) should be false. In other words, for the existence of effect E2 the character in column 1 should not be either A or B. We can see in the graph, C1 OR C2 is connected through NOT logic with effect E2.
Effect E3 – Displays Massage Y- The logic for the existence of effect E3 is “NOT C3” that means cause C3 (Character in column 2 is a digit) should be false. In other words, for the existence of effect E3, the character in column 2 should not be a digit. We can see in the graph, C3 is connected through NOT logic with effect E3.
So, it is the cause-effect graph for the given situation. A tester needs to convert causes and effects into logical statements and then design cause-effect graph. If function gives output (effect) according to the input (cause) so, it is considered as defect free, and if not doing so, then it is sent to the development team for the correction.
Conclusion
Summary of the steps:
- Draw the circles for effects and Causes.
- Start from effect and then pick up what is the cause of this effect.
- Draw mutually exclusive causes (exclusive causes which are directly connected via one effect and one cause) at last.
- Use logic gates to draw dynamic test cases.