Chi-Square Test
The Chi-Square Test is used to analyze the frequency table (i.e., contingency table), which is formed by two categorical variables. The chi-square test evaluates whether there is a significant relationship between the categories of the two variables.
The Chi-Square Test is a statistical method which is used to determine whether two categorical variables have a significant correlation between them. These variables should be from the same population and should be categorical like- Yes/No, Red/Green, Male/Female, etc.
R provides chisq.test() function to perform chi-square test. This function takes data as an input, which is in the table form, containing the count value of the variables in the observation.

In R, there is the following syntax of chisq.test() function:
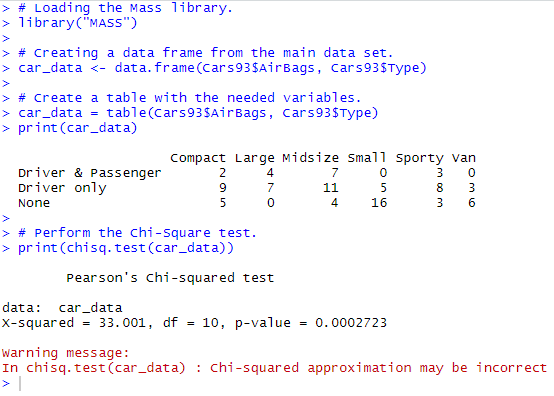
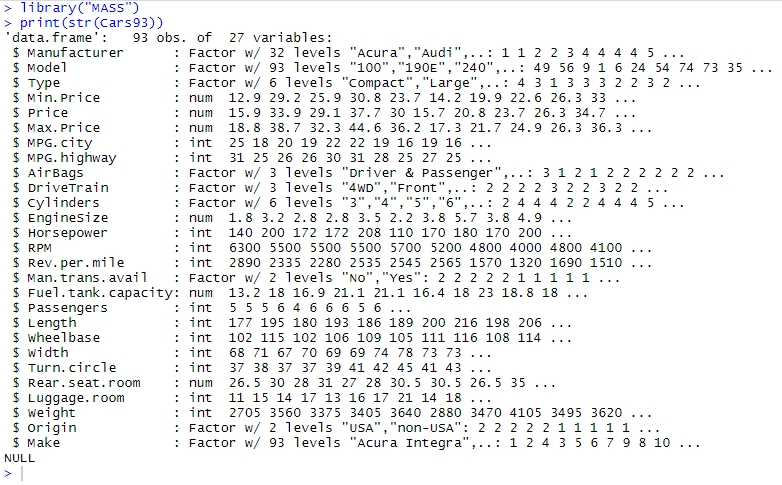
Let’s see an example in which we will take the Cars93 data present in the “Mass” library. This data represents the sales of different models of cars in the year 1993.
Data:
Output:
Example:
Output: