Gouraud shading
This Intensity-Interpolation scheme, developed by Gouraud and usually referred to as Gouraud Shading, renders a polygon surface by linear interpolating intensity value across the surface. Intensity values for each polygon are coordinate with the value of adjacent polygons along the common edges, thus eliminating the intensity discontinuities that can occur in flat shading.
Each polygon surface is rendered with Gouraud Shading by performing the following calculations:
- Determining the average unit normal vector at each polygon vertex.
- Apply an illumination model to each vertex to determine the vertex intensity.
- Linear interpolate the vertex intensities over the surface of the polygon.
At each polygon vertex, we obtain a normal vector by averaging the surface normals of all polygons staring that vertex as shown in fig:
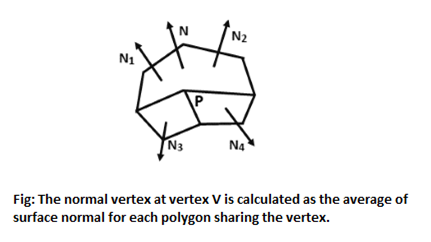
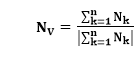
Thus, for any vertex position V, we acquire the unit vertex normal with the calculation
Once we have the vertex normals, we can determine the intensity at the vertices from a lighting model.
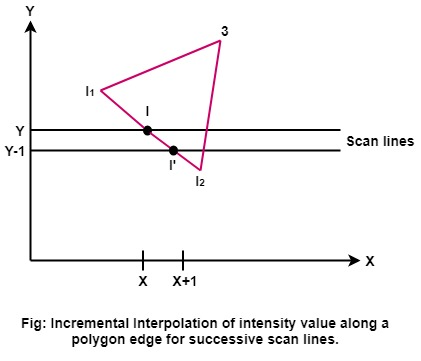
Following figures demonstrate the next step: Interpolating intensities along the polygon edges. For each scan line, the intensities at the intersection of the scan line with a polygon edge are linearly interpolated from the intensities at the edge endpoints. For example: In fig, the polygon edge with endpoint vertices at position 1 and 2 is intersected by the scanline at point 4. A fast method for obtaining the intensities at point 4 is to interpolate between intensities I1 and I2 using only the vertical displacement of the scan line.
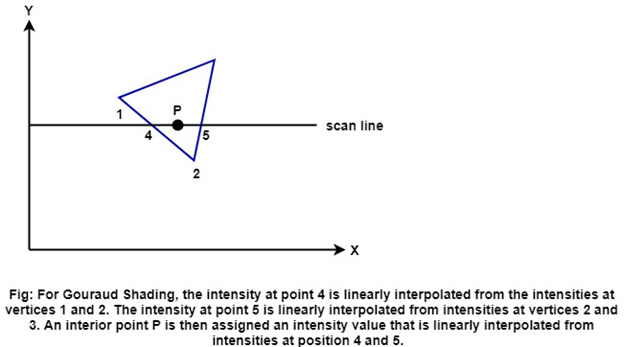
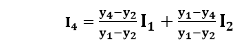
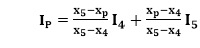
Similarly, the intensity at the right intersection of this scan line (point 5) is interpolated from the intensity values at vertices 2 and 3. Once these bounding intensities are established for a scan line, an interior point (such as point P in the previous fig) is interpolated from the bounding intensities at point 4 and 5 as
Incremental calculations are used to obtain successive edge intensity values between scan lines and to obtain successive intensities along a scan line as shown in fig:
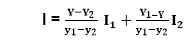
If the intensity at edge position (x, y) is interpolated as
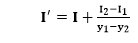
Then we can obtain the intensity along this edge for the next scan line, Y-1 as
Similar calculations are used to obtain intensities at successive horizontal pixel positions along each scan line.
When surfaces are to be rendered in color, the intensities of each color component is calculated at the vertices. Gouraud Shading can be connected with a hidden-surface algorithm to fill in the visible polygons along each scan-line. An example of an object-shaded with the Gouraud method appears in the following figure:
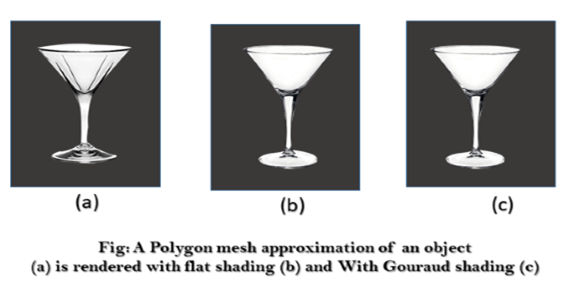
Gouraud Shading discards the intensity discontinuities associated with the constant-shading model, but it has some other deficiencies. Highlights on the surface are sometimes displayed with anomalous shapes, and the linear intensity interpolation can cause bright or dark intensity streaks, called Match bands, to appear on the surface. These effects can be decreased by dividing the surface into a higher number of polygon faces or by using other methods, such as Phong shading, that requires more calculations.