Data Transformation in Data Mining
Raw data is difficult to trace or understand. That’s why it needs to be preprocessed before retrieving any information from it. Data transformation is a technique used to convert the raw data into a suitable format that efficiently eases data mining and retrieves strategic information. Data transformation includes data cleaning techniques and a data reduction technique to convert the data into the appropriate form.
Data transformation is an essential data preprocessing technique that must be performed on the data before data mining to provide patterns that are easier to understand.
Data transformation changes the format, structure, or values of the data and converts them into clean, usable data. Data may be transformed at two stages of the data pipeline for data analytics projects. Organizations that use on-premises data warehouses generally use an ETL (extract, transform, and load) process, in which data transformation is the middle step. Today, most organizations use cloud-based data warehouses to scale compute and storage resources with latency measured in seconds or minutes. The scalability of the cloud platform lets organizations skip preload transformations and load raw data into the data warehouse, then transform it at query time.
Data integration, migration, data warehousing, data wrangling may all involve data transformation. Data transformation increases the efficiency of business and analytic processes, and it enables businesses to make better data-driven decisions. During the data transformation process, an analyst will determine the structure of the data. This could mean that data transformation may be:
- Constructive: The data transformation process adds, copies, or replicates data.
- Destructive: The system deletes fields or records.
- Aesthetic: The transformation standardizes the data to meet requirements or parameters.
- Structural: The database is reorganized by renaming, moving, or combining columns.
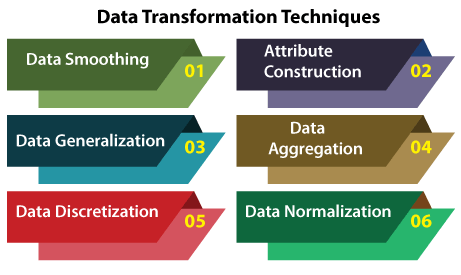
Data Transformation Techniques
There are several data transformation techniques that can help structure and clean up the data before analysis or storage in a data warehouse. Let’s study all techniques used for data transformation, some of which we have already studied in data reduction and data cleaning.
1. Data Smoothing
Data smoothing is a process that is used to remove noise from the dataset using some algorithms. It allows for highlighting important features present in the dataset. It helps in predicting the patterns. When collecting data, it can be manipulated to eliminate or reduce any variance or any other noise form.
The concept behind data smoothing is that it will be able to identify simple changes to help predict different trends and patterns. This serves as a help to analysts or traders who need to look at a lot of data which can often be difficult to digest for finding patterns that they wouldn’t see otherwise.
We have seen how the noise is removed from the data using the techniques such as binning, regression, clustering.
- Binning: This method splits the sorted data into the number of bins and smoothens the data values in each bin considering the neighborhood values around it.
- Regression: This method identifies the relation among two dependent attributes so that if we have one attribute, it can be used to predict the other attribute.
- Clustering: This method groups similar data values and form a cluster. The values that lie outside a cluster are known as outliers.
2. Attribute Construction
In the attribute construction method, the new attributes consult the existing attributes to construct a new data set that eases data mining. New attributes are created and applied to assist the mining process from the given attributes. This simplifies the original data and makes the mining more efficient.
For example, suppose we have a data set referring to measurements of different plots, i.e., we may have the height and width of each plot. So here, we can construct a new attribute ‘area’ from attributes ‘height’ and ‘weight’. This also helps understand the relations among the attributes in a data set.
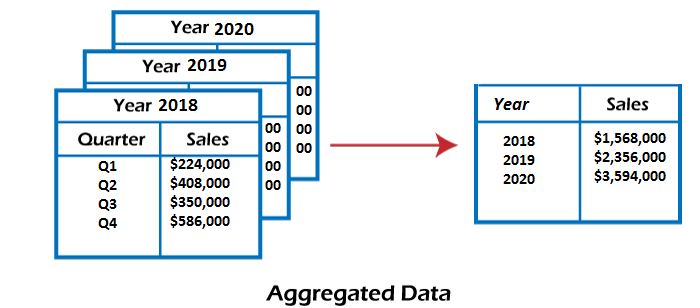
3. Data Aggregation
Data collection or aggregation is the method of storing and presenting data in a summary format. The data may be obtained from multiple data sources to integrate these data sources into a data analysis description. This is a crucial step since the accuracy of data analysis insights is highly dependent on the quantity and quality of the data used.
Gathering accurate data of high quality and a large enough quantity is necessary to produce relevant results. The collection of data is useful for everything from decisions concerning financing or business strategy of the product, pricing, operations, and marketing strategies.
For example, we have a data set of sales reports of an enterprise that has quarterly sales of each year. We can aggregate the data to get the enterprise’s annual sales report.
4. Data Normalization
Normalizing the data refers to scaling the data values to a much smaller range such as [-1, 1] or [0.0, 1.0]. There are different methods to normalize the data, as discussed below.
Consider that we have a numeric attribute A and we have n number of observed values for attribute A that are V1, V2, V3, ….Vn.
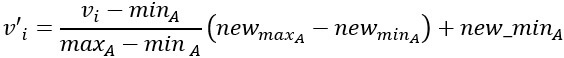
- Min-max normalization: This method implements a linear transformation on the original data. Let us consider that we have minA and maxA as the minimum and maximum value observed for attribute A and Viis the value for attribute A that has to be normalized.
The min-max normalization would map Vi to the V’i in a new smaller range [new_minA, new_maxA]. The formula for min-max normalization is given below:

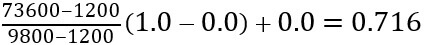
For example, we have $1200 and $9800 as the minimum, and maximum value for the attribute income, and [0.0, 1.0] is the range in which we have to map a value of $73,600.
The value $73,600 would be transformed using min-max normalization as follows:
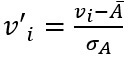
- Z-score normalization: This method normalizes the value for attribute A using the meanand standard deviation. The following formula is used for Z-score normalization:
Here Ᾱ and σA are the mean and standard deviation for attribute A, respectively.
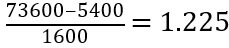
For example, we have a mean and standard deviation for attribute A as $54,000 and $16,000. And we have to normalize the value $73,600 using z-score normalization.
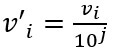
- Decimal Scaling: This method normalizes the value of attribute A by moving the decimal point in the value. This movement of a decimal point depends on the maximum absolute value of A. The formula for the decimal scaling is given below:
Here j is the smallest integer such that max(|v’i|)<1
For example, the observed values for attribute A range from -986 to 917, and the maximum absolute value for attribute A is 986. Here, to normalize each value of attribute A using decimal scaling, we have to divide each value of attribute A by 1000, i.e., j=3.
So, the value -986 would be normalized to -0.986, and 917 would be normalized to 0.917.
The normalization parameters such as mean, standard deviation, the maximum absolute value must be preserved to normalize the future data uniformly.
5. Data Discretization
This is a process of converting continuous data into a set of data intervals. Continuous attribute values are substituted by small interval labels. This makes the data easier to study and analyze. If a data mining task handles a continuous attribute, then its discrete values can be replaced by constant quality attributes. This improves the efficiency of the task.
This method is also called a data reduction mechanism as it transforms a large dataset into a set of categorical data. Discretization also uses decision tree-based algorithms to produce short, compact, and accurate results when using discrete values.
Data discretization can be classified into two types: supervised discretization, where the class information is used, and unsupervised discretization, which is based on which direction the process proceeds, i.e., ‘top-down splitting strategy’ or ‘bottom-up merging strategy’.
For example, the values for the age attribute can be replaced by the interval labels such as (0-10, 11-20…) or (kid, youth, adult, senior).
6. Data Generalization
It converts low-level data attributes to high-level data attributes using concept hierarchy. This conversion from a lower level to a higher conceptual level is useful to get a clearer picture of the data. Data generalization can be divided into two approaches:
- Data cube process (OLAP) approach.
- Attribute-oriented induction (AOI) approach.
For example, age data can be in the form of (20, 30) in a dataset. It is transformed into a higher conceptual level into a categorical value (young, old).
Data Transformation Process
The entire process for transforming data is known as ETL (Extract, Load, and Transform). Through the ETL process, analysts can convert data to its desired format. Here are the steps involved in the data transformation process:
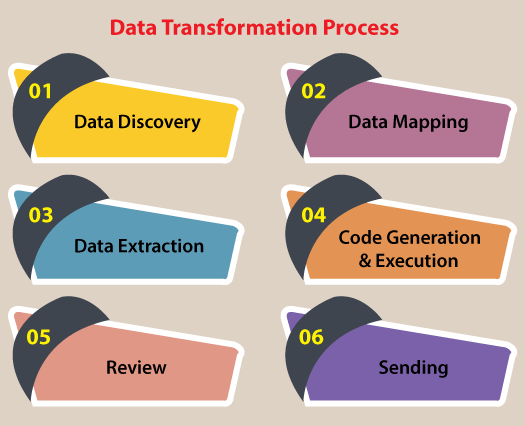
- Data Discovery: During the first stage, analysts work to understand and identify data in its source format. To do this, they will use data profiling tools. This step helps analysts decide what they need to do to get data into its desired format.
- Data Mapping: During this phase, analysts perform data mapping to determine how individual fields are modified, mapped, filtered, joined, and aggregated. Data mapping is essential to many data processes, and one misstep can lead to incorrect analysis and ripple through your entire organization.
- Data Extraction: During this phase, analysts extract the data from its original source. These may include structured sources such as databases or streaming sources such as customer log files from web applications.
- Code Generation and Execution: Once the data has been extracted, analysts need to create a code to complete the transformation. Often, analysts generate codes with the help of data transformation platforms or tools.
- Review: After transforming the data, analysts need to check it to ensure everything has been formatted correctly.
- Sending: The final step involves sending the data to its target destination. The target might be a data warehouse or a database that handles both structured and unstructured data.
Advantages of Data Transformation
Transforming data can help businesses in a variety of ways. Here are some of the essential advantages of data transformation, such as:
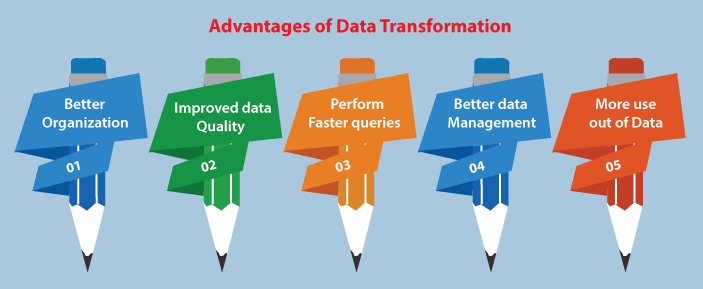
- Better Organization: Transformed data is easier for both humans and computers to use.
- Improved Data Quality: There are many risks and costs associated with bad data. Data transformation can help your organization eliminate quality issues such as missing values and other inconsistencies.
- Perform Faster Queries: You can quickly and easily retrieve transformed data thanks to it being stored and standardizedin a source location.
- Better Data Management: Businesses are constantly generating data from more and more sources. If there are inconsistencies in the metadata, it can be challenging to organize and understand it. Data transformation refines your metadata, so it’s easier to organize and understand.
- More Use Out of Data: While businesses may be collecting data constantly, a lot of that data sits around unanalyzed. Transformation makes it easier to get the most out of your data by standardizing it and making it more usable.
Disadvantages of Data Transformation
While data transformation comes with a lot of benefits, still there are some challenges to transforming data effectively, such as:
- Data transformation can be expensive. The cost is dependent on the specific infrastructure, software, and tools used to process data. Expenses may include licensing, computing resources, and hiring necessary personnel.
- Data transformation processes can be resource-intensive. Performing transformations in an on-premises data warehouse after loading or transforming data before feeding it into applications can create a computational burden that slows down other operations. If you use a cloud-based data warehouse, you can do the transformations after loading because the platform can scale up to meet demand.
- Lack of expertise and carelessness can introduce problems during transformation. Data analysts without appropriate subject matter expertise are less likely to notice incorrect data because they are less familiar with the range of accurate and permissible values.
- Enterprises can perform transformations that don’t suit their needs. A business might change information to a specific format for one application only to then revert the information to its prior format for a different application.
Ways of Data Transformation
There are several different ways to transform data, such as:
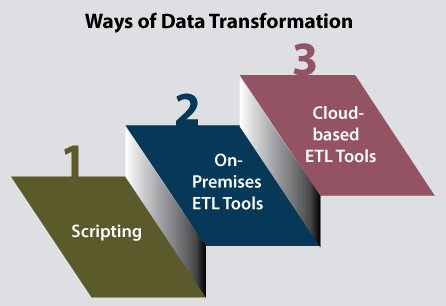
- Scripting: Data transformation through scripting involves Python or SQL to write the code to extract and transform data. Python and SQL are scripting languages that allow you to automate certain tasks in a program. They also allow you to extract information from data sets. Scripting languages require less code than traditional programming languages. Therefore, it is less intensive.
- On-Premises ETL Tools: ETL tools take the required work to script the data transformation by automating the process. On-premises ETL tools are hosted on company servers. While these tools can help save you time, using them often requires extensive expertise and significant infrastructure costs.
- Cloud-Based ETL Tools: As the name suggests, cloud-based ETL tools are hosted in the cloud. These tools are often the easiest for non-technical users to utilize. They allow you to collect data from any cloud source and load it into your data warehouse. With cloud-based ETL tools, you can decide how often you want to pull data from your source, and you can monitor your usage.