What is Quantization?
Quantization is a lossy compression technique which is achieved by compressing a range of values to single quantum. In other words, we can also say that it is a process of converting a continuous range of values into a finite range of discrete values. In a given stream when discrete symbols are reduced then, the stream becomes more compressible.
For example, when we reduce the number of colors in a digital image the file size is also reduced.
Applications such as DCT data quantization in JPEG and DWT data quantization in JPEG 2000 are used.
As we know that bits are used to represent a pixel intensity, which is limited that is why quantization is needed.
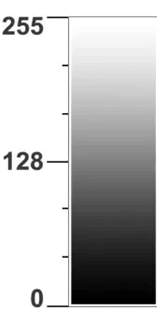
If 8 bit is used for a pixel which is in the range from 0 to 255 where 0 is used for pure black and 255 is used for pure white and the intermediate values are used for gray color.
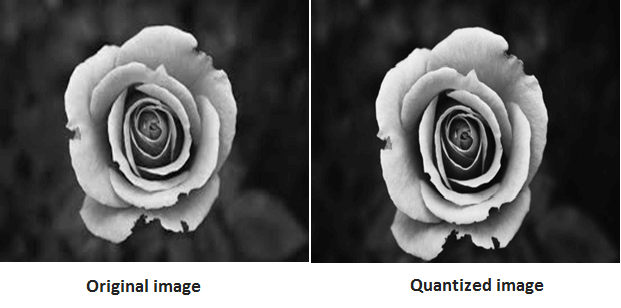
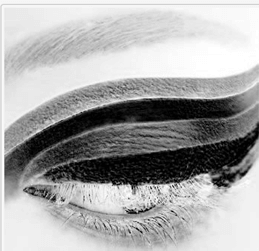
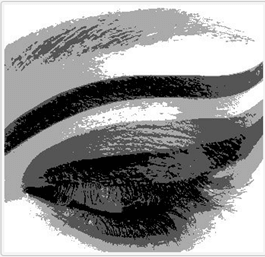
In the above images, the original image is of quantization level 257, and the quantized image is of quantization level 16.
Contouring
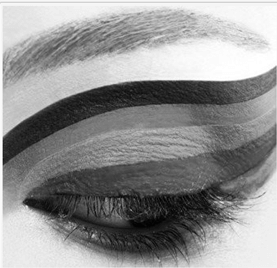
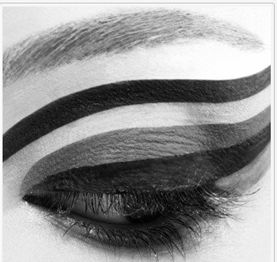
As we have seen in quantization that when the number of gray levels in an image is decreased, some false colors and edges start appearing on the image.
Let’s consider an image of 8 bpp which have following gray level:
256 shade of gray.
128 shade of gray.
64 shade of gray.
32 shade of gray.
We can see in the above images when the level of gray decreases lines starts appearing on the image.
As compared to 64 shade of gray, we can see more lines in 32 shade of gray. This is known as contouring.
ISO preference curves
We have seen the effect of gray level and contouring. These results can be shown in the form of curves which is known as ISO preference curve.
An ISO preference curve shows that the effect of contouring does not depend on decreasing of the gray level resolution, but it also depends on the image detail.
In other words, we can say that if an image is more detail, then the effect of contouring appears in the image later as compared to a less detail image in which gray level is quantized.
See the following three images to understand Gray level resolution clearly:
Image 1
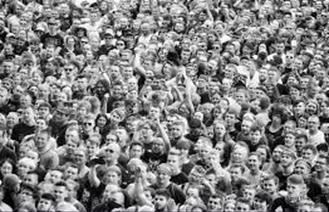
Image 2

Image 3

In image 1, we can see the crowd which is very less detailed.
In image 2, only one face is more detailed as compared to another.
And image 3 is more detailed as compared to image 1 and image 2.
You see these variations in the above images because of the gray level resolution. We can plot a graph according to the results.
In the below graph each curve represents one image.
Here, x-axis represents gray levels and the y-axis represents bits per pixel (k). 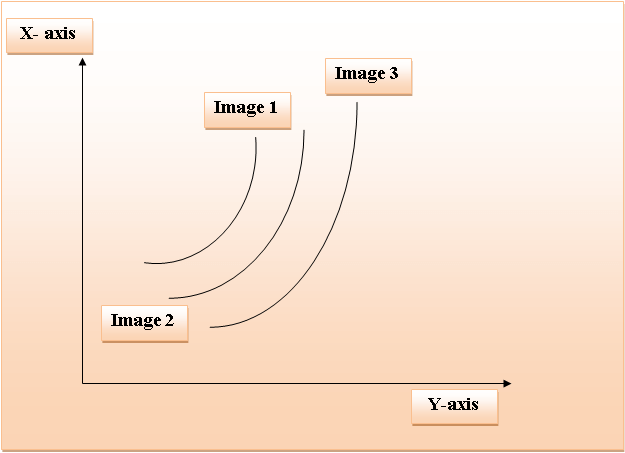
According to the above graph, in image 1 faces cannot be seen due to contouring. In image 2, the face of the girl was more detailed as compared to the face of a boy due to contouring. And in image 3, the boy in the image can be seen more clearly due is less contouring effect because this image is more detailed.
We can say that when an image is more detailed the ISO preference curve is more vertical and also if an image is more detailed then very less gray level resolution is required.