Hierarchical Clustering in Machine Learning
Hierarchical clustering is another unsupervised machine learning algorithm, which is used to group the unlabeled datasets into a cluster and also known as hierarchical cluster analysis or HCA.
In this algorithm, we develop the hierarchy of clusters in the form of a tree, and this tree-shaped structure is known as the dendrogram.
Sometimes the results of K-means clustering and hierarchical clustering may look similar, but they both differ depending on how they work. As there is no requirement to predetermine the number of clusters as we did in the K-Means algorithm.
The hierarchical clustering technique has two approaches:
- Agglomerative: Agglomerative is a bottom-up approach, in which the algorithm starts with taking all data points as single clusters and merging them until one cluster is left.
- Divisive: Divisive algorithm is the reverse of the agglomerative algorithm as it is a top-down approach.
Why hierarchical clustering?
As we already have other clustering algorithms such as K-Means Clustering, then why we need hierarchical clustering? So, as we have seen in the K-means clustering that there are some challenges with this algorithm, which are a predetermined number of clusters, and it always tries to create the clusters of the same size. To solve these two challenges, we can opt for the hierarchical clustering algorithm because, in this algorithm, we don’t need to have knowledge about the predefined number of clusters.
In this topic, we will discuss the Agglomerative Hierarchical clustering algorithm.
Agglomerative Hierarchical clustering
The agglomerative hierarchical clustering algorithm is a popular example of HCA. To group the datasets into clusters, it follows the bottom-up approach. It means, this algorithm considers each dataset as a single cluster at the beginning, and then start combining the closest pair of clusters together. It does this until all the clusters are merged into a single cluster that contains all the datasets.
This hierarchy of clusters is represented in the form of the dendrogram.
How the Agglomerative Hierarchical clustering Work?
The working of the AHC algorithm can be explained using the below steps:
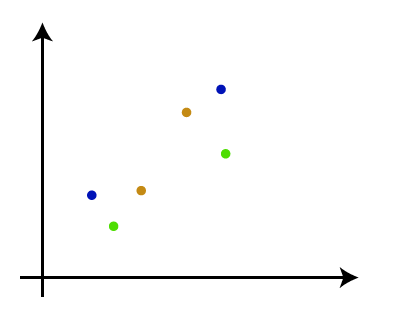
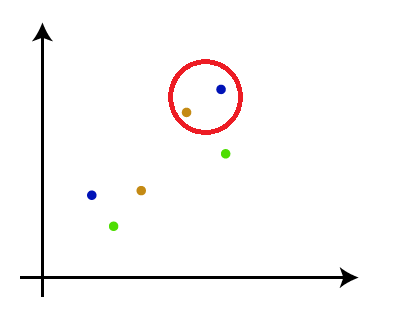
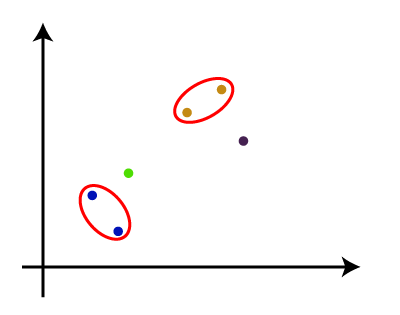
- Step-1: Create each data point as a single cluster. Let’s say there are N data points, so the number of clusters will also be N.

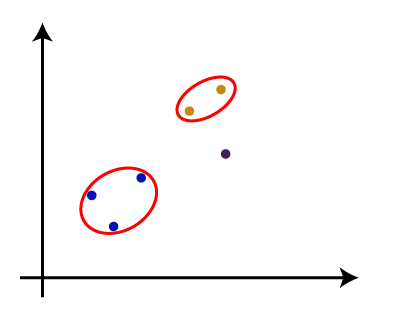
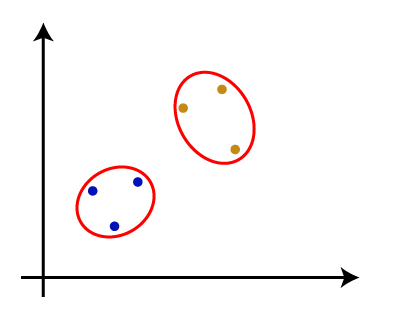
- Step-2: Take two closest data points or clusters and merge them to form one cluster. So, there will now be N-1 clusters.
- Step-3: Again, take the two closest clusters and merge them together to form one cluster. There will be N-2 clusters.
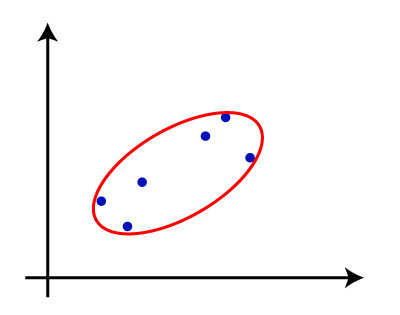
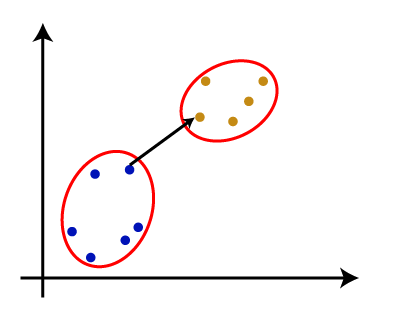
- Step-4: Repeat Step 3 until only one cluster left. So, we will get the following clusters. Consider the below images:
- Step-5: Once all the clusters are combined into one big cluster, develop the dendrogram to divide the clusters as per the problem.
Note: To better understand hierarchical clustering, it is advised to have a look on k-means clustering
Measure for the distance between two clusters
As we have seen, the closest distance between the two clusters is crucial for the hierarchical clustering. There are various ways to calculate the distance between two clusters, and these ways decide the rule for clustering. These measures are called Linkage methods. Some of the popular linkage methods are given below:
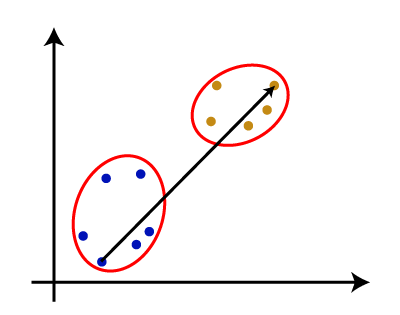
- Single Linkage: It is the Shortest Distance between the closest points of the clusters. Consider the below image:
- Complete Linkage: It is the farthest distance between the two points of two different clusters. It is one of the popular linkage methods as it forms tighter clusters than single-linkage.
- Average Linkage: It is the linkage method in which the distance between each pair of datasets is added up and then divided by the total number of datasets to calculate the average distance between two clusters. It is also one of the most popular linkage methods.
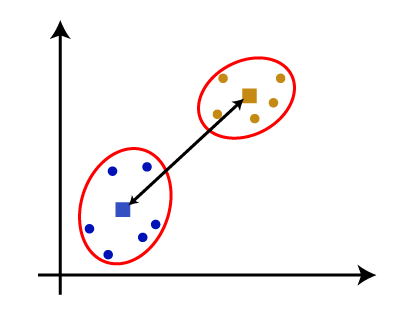
- Centroid Linkage: It is the linkage method in which the distance between the centroid of the clusters is calculated. Consider the below image:
From the above-given approaches, we can apply any of them according to the type of problem or business requirement.
Woking of Dendrogram in Hierarchical clustering
The dendrogram is a tree-like structure that is mainly used to store each step as a memory that the HC algorithm performs. In the dendrogram plot, the Y-axis shows the Euclidean distances between the data points, and the x-axis shows all the data points of the given dataset.
The working of the dendrogram can be explained using the below diagram:
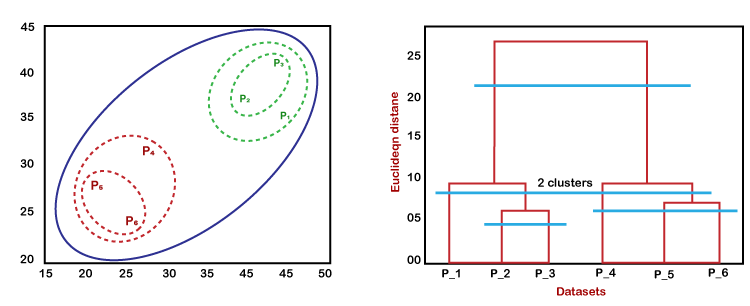
In the above diagram, the left part is showing how clusters are created in agglomerative clustering, and the right part is showing the corresponding dendrogram.
- As we have discussed above, firstly, the datapoints P2 and P3 combine together and form a cluster, correspondingly a dendrogram is created, which connects P2 and P3 with a rectangular shape. The hight is decided according to the Euclidean distance between the data points.
- In the next step, P5 and P6 form a cluster, and the corresponding dendrogram is created. It is higher than of previous, as the Euclidean distance between P5 and P6 is a little bit greater than the P2 and P3.
- Again, two new dendrograms are created that combine P1, P2, and P3 in one dendrogram, and P4, P5, and P6, in another dendrogram.
- At last, the final dendrogram is created that combines all the data points together.
We can cut the dendrogram tree structure at any level as per our requirement.
Python Implementation of Agglomerative Hierarchical Clustering
Now we will see the practical implementation of the agglomerative hierarchical clustering algorithm using Python. To implement this, we will use the same dataset problem that we have used in the previous topic of K-means clustering so that we can compare both concepts easily.
The dataset is containing the information of customers that have visited a mall for shopping. So, the mall owner wants to find some patterns or some particular behavior of his customers using the dataset information.
Steps for implementation of AHC using Python:
The steps for implementation will be the same as the k-means clustering, except for some changes such as the method to find the number of clusters. Below are the steps:
- Data Pre-processing
- Finding the optimal number of clusters using the Dendrogram
- Training the hierarchical clustering model
- Visualizing the clusters
Data Pre-processing Steps:
In this step, we will import the libraries and datasets for our model.
- Importing the libraries
The above lines of code are used to import the libraries to perform specific tasks, such as numpy for the Mathematical operations, matplotlib for drawing the graphs or scatter plot, and pandas for importing the dataset.
- Importing the dataset
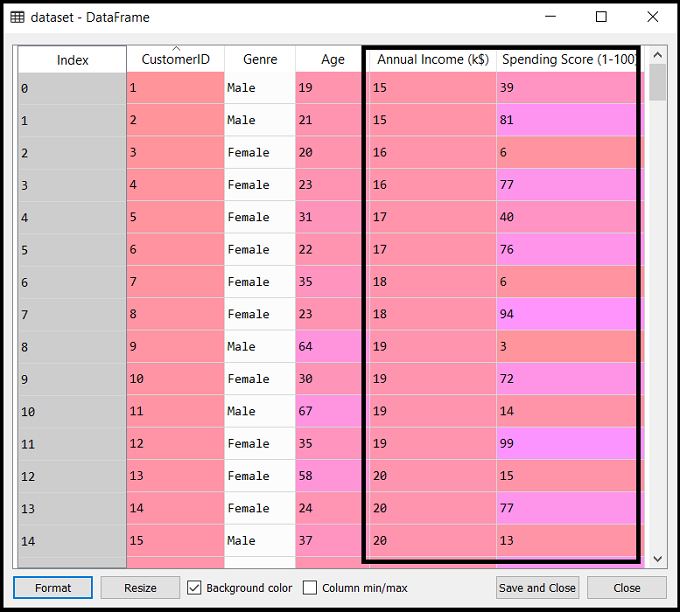
As discussed above, we have imported the same dataset of Mall_Customers_data.csv, as we did in k-means clustering. Consider the below output:
- Extracting the matrix of features
Here we will extract only the matrix of features as we don’t have any further information about the dependent variable. Code is given below:
Here we have extracted only 3 and 4 columns as we will use a 2D plot to see the clusters. So, we are considering the Annual income and spending score as the matrix of features.
Step-2: Finding the optimal number of clusters using the Dendrogram
Now we will find the optimal number of clusters using the Dendrogram for our model. For this, we are going to use scipy library as it provides a function that will directly return the dendrogram for our code. Consider the below lines of code:
In the above lines of code, we have imported the hierarchy module of scipy library. This module provides us a method shc.denrogram(), which takes the linkage() as a parameter. The linkage function is used to define the distance between two clusters, so here we have passed the x(matrix of features), and method “ward,” the popular method of linkage in hierarchical clustering.
The remaining lines of code are to describe the labels for the dendrogram plot.
Output:
By executing the above lines of code, we will get the below output:
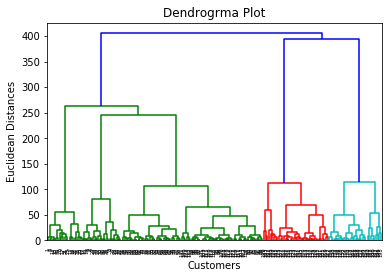
Using this Dendrogram, we will now determine the optimal number of clusters for our model. For this, we will find the maximum vertical distance that does not cut any horizontal bar. Consider the below diagram:
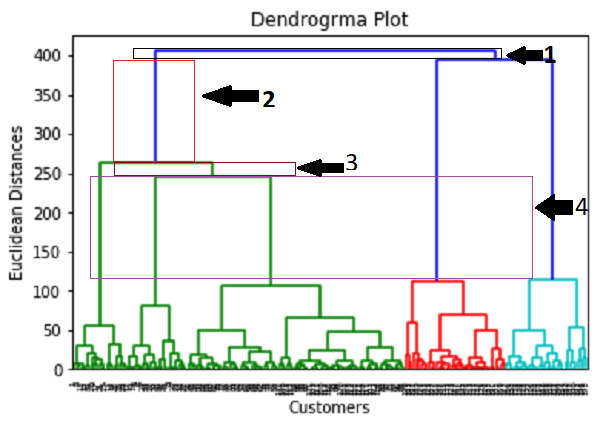
In the above diagram, we have shown the vertical distances that are not cutting their horizontal bars. As we can visualize, the 4th distance is looking the maximum, so according to this, the number of clusters will be 5(the vertical lines in this range). We can also take the 2nd number as it approximately equals the 4th distance, but we will consider the 5 clusters because the same we calculated in the K-means algorithm.
So, the optimal number of clusters will be 5, and we will train the model in the next step, using the same.
Step-3: Training the hierarchical clustering model
As we know the required optimal number of clusters, we can now train our model. The code is given below:
In the above code, we have imported the AgglomerativeClustering class of cluster module of scikit learn library.
Then we have created the object of this class named as hc. The AgglomerativeClustering class takes the following parameters:
- n_clusters=5: It defines the number of clusters, and we have taken here 5 because it is the optimal number of clusters.
- affinity=’euclidean’: It is a metric used to compute the linkage.
- linkage=’ward’: It defines the linkage criteria, here we have used the “ward” linkage. This method is the popular linkage method that we have already used for creating the Dendrogram. It reduces the variance in each cluster.
In the last line, we have created the dependent variable y_pred to fit or train the model. It does train not only the model but also returns the clusters to which each data point belongs.
After executing the above lines of code, if we go through the variable explorer option in our Sypder IDE, we can check the y_pred variable. We can compare the original dataset with the y_pred variable. Consider the below image:
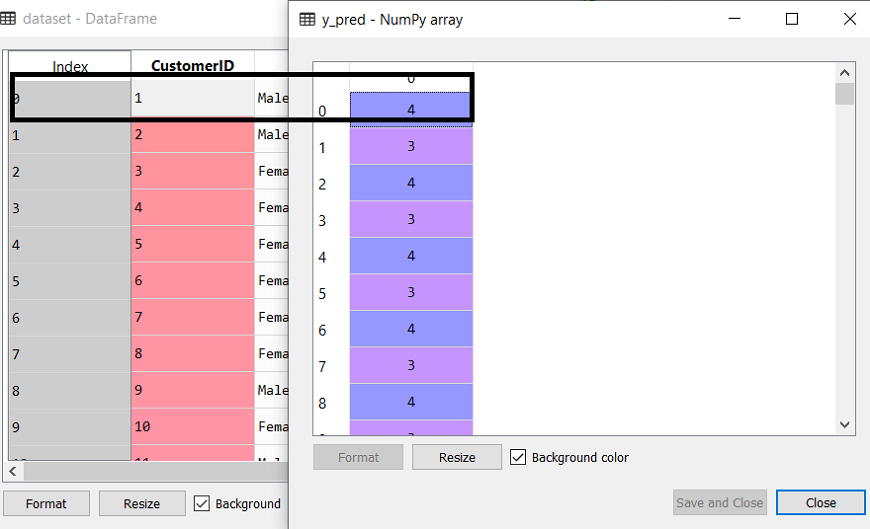
As we can see in the above image, the y_pred shows the clusters value, which means the customer id 1 belongs to the 5th cluster (as indexing starts from 0, so 4 means 5th cluster), the customer id 2 belongs to 4th cluster, and so on.
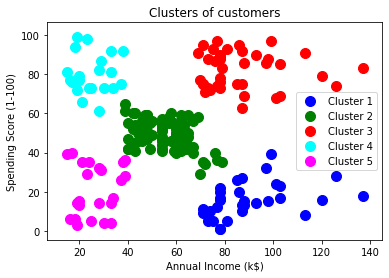
Step-4: Visualizing the clusters
As we have trained our model successfully, now we can visualize the clusters corresponding to the dataset.
Here we will use the same lines of code as we did in k-means clustering, except one change. Here we will not plot the centroid that we did in k-means, because here we have used dendrogram to determine the optimal number of clusters. The code is given below:
Output: By executing the above lines of code, we will get the below output: