How to Plot Rays on a Graph using Bokeh in Python
Bokeh is a Python library which is used for data visualization. It creates its plots using HTML and JavaScript languages, and it also targets modern website browsers to provide presentation elegant, concise construction of novel graphics good high-performance interactivity.
In this tutorial, we will learn how to plot rays on a graph. To plot rays on a graph we can use the ray() function of the bokeh.plotting module.
plotting.figure.ray()
Syntax:
The syntax for ray() function is:
Parameters:
The parameters of ray() function are:
- x: It takes x-coordinate values of the starting points of the rays.
- y: It takes y-coordinate values of the starting points of the rays
- length: It takes value of ray length as input.
- length_units: It takes unit of the length of the rays.
Returns:
The return of ray() function is:
An object of class GlyphRenderer
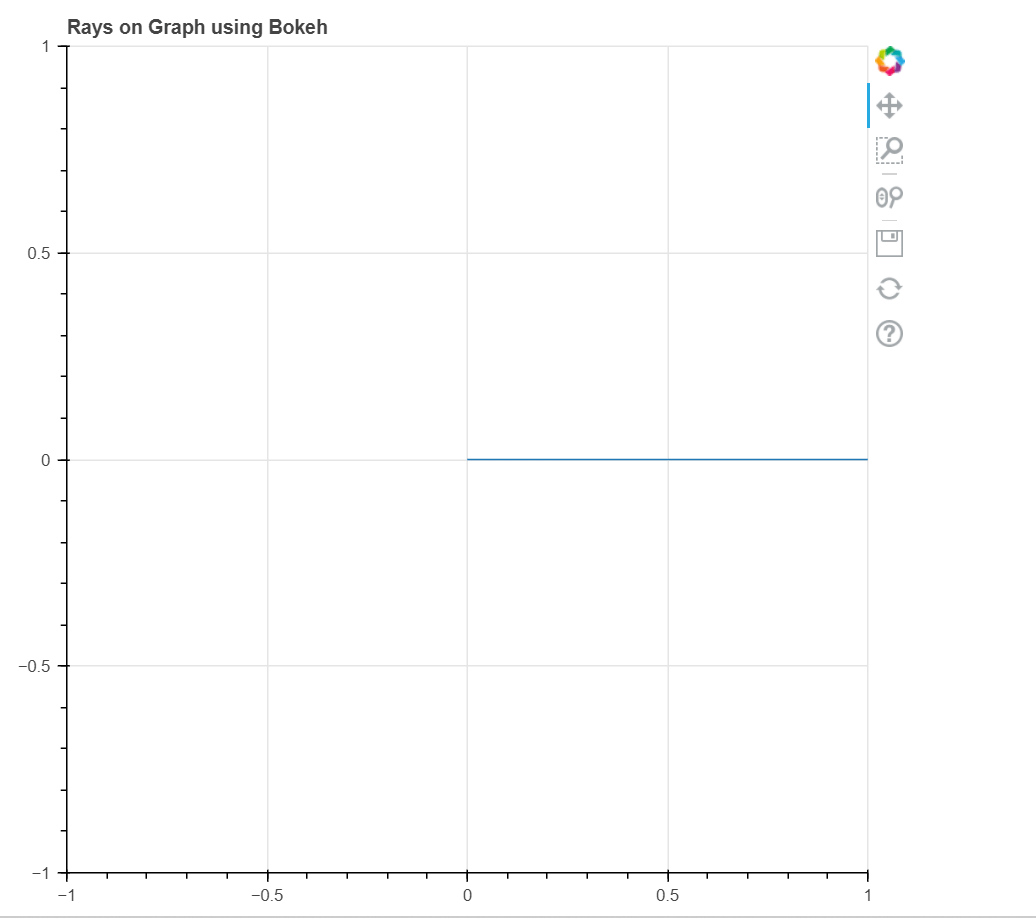
Example 1:
In this example we will be using the default values for plotting the graph.
Code:
Output:
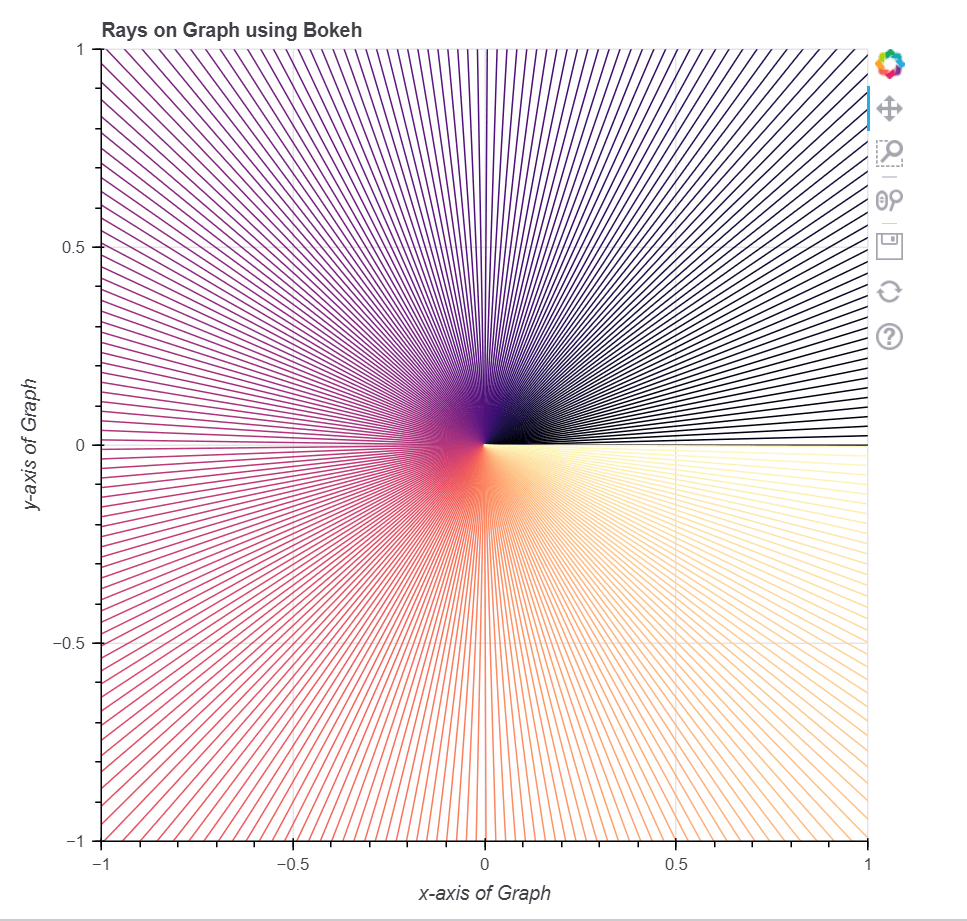
Example 2:
In this example we will be plotting multiple rays with various other parameters.
Code:
Output:
Conclusion
In this tutorial, we discussed how to plot rays on Graph using the bokeh library in Python.