IntelliJ IDEA Profiler
Profiler gives an accurate information about our application performance. It measures the performance of CPU, Memory and Heap usage by our application. It also provides us the detailed information about application thread. VisualVM tool is used to measure the Java application profiling.
What is VisualVM?
It is a visual tool which has been bundled with the JDK along with Java 6 or greater version. It is good for beginners and gives detailed information about our application performance.
Configuration
In Windows
- Download VisualVM. To download Click here.
- Extract the Downloaded Zip file.
- In the extracted file go to etc/visualvm.conf file. Check the following line visualvm_jdkhome=””
- If Jdk is installed then it should look like this visualvm_jdkhome=”C:Program FilesJavajdk-8.0.1″
In Linux
To install VisualVM, type the following in the terminal:
- $ sudo apt-get install default-jdk.
- $ sudo apt install visualvm.
- To open VisualVM type $ visualvm.
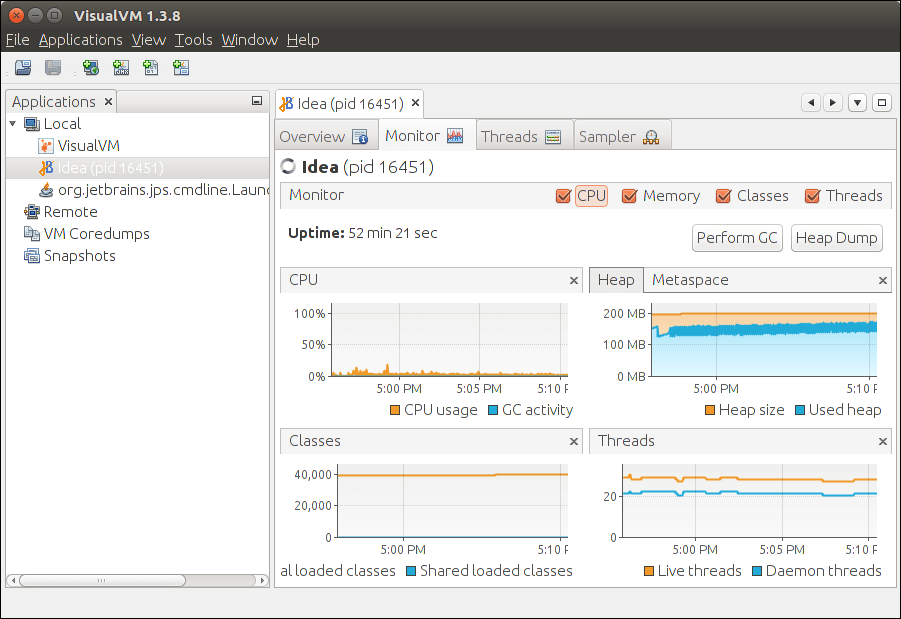
Monitoring Application
- Open visualvm.
- Select Application in the left pane.
- Choose the Monitor tab.
We can see here about the usage of CPU, Heap, Classes and Threads. We can also see specific usage by hovering the mouse over any graph.
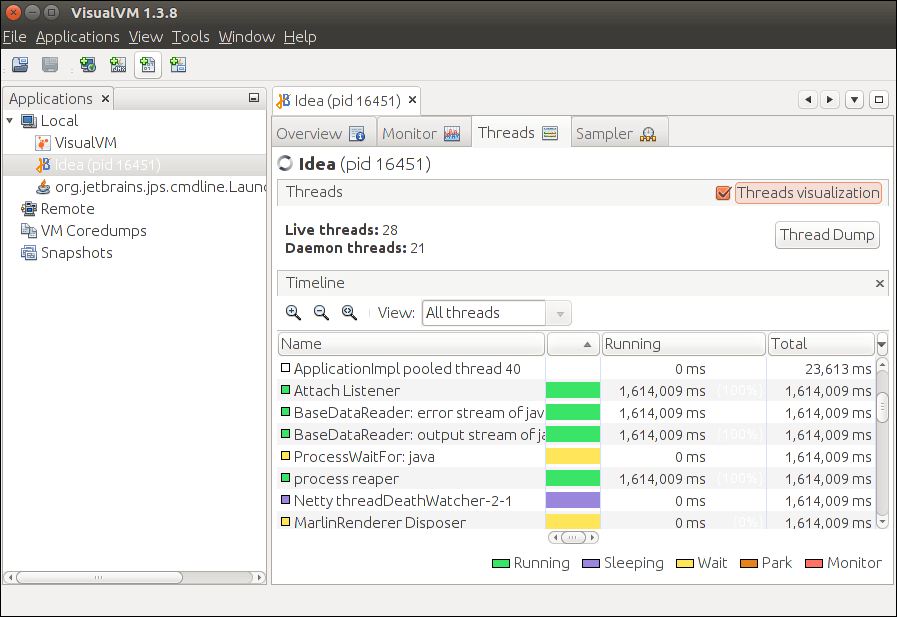
Threads Measure
Every Java application have multiple Threads. We can see the detailed information about threads in VisualVM tool. Select Thread tab, it will show various statistics about our application threads such as number of Live threads and Daemon threads . We can see it in the following figure in which Running, Sleeping, Wait, Park, Monitor thread shown us.
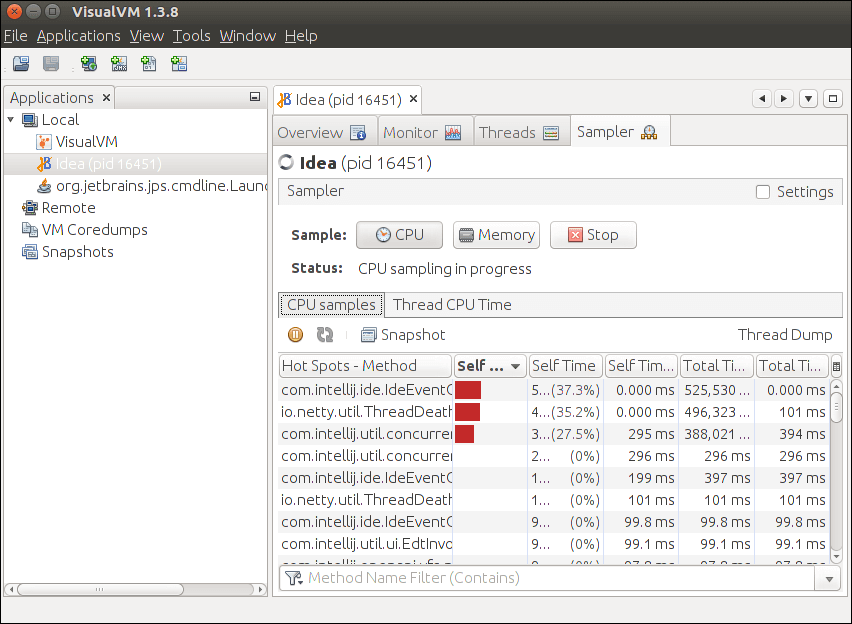
Sampling Application
VisualVM gives us the information of CPU, Memory Sampling and Memory Leak. To do sampling, select application and choose Sampler tab. Sampler Tab have three Sub-Tab-: CPU Tab, Memory Tab, and Stop Tap.
CPU Sampling
To do the CPU sampling, click on CPU button. The following screenshot will appear.
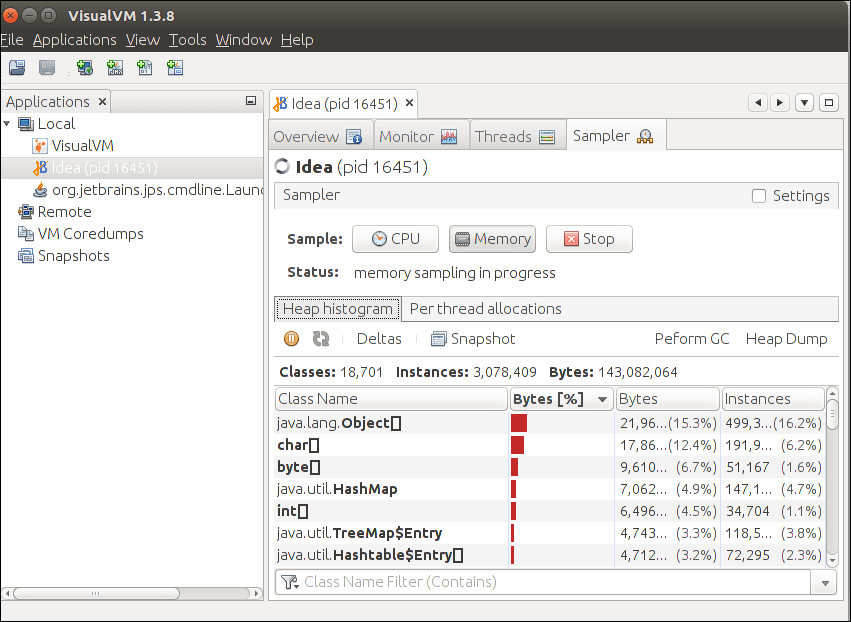
Memory Sampling
To do the Memory Sampling, click on Memory button. The following screenshot will appear.
Memory Leaks
Memory leak is a situation where some objects are not used in the application anymore and garbage collector fails to recognize them as unused. During the running of program, it fills up the heap area with an object which are not used in the program. When the memory space is full because of the unnecessary object storage then we can understand it the indication of the memory leak.