Jira Reports
Reports are used to track and analyze the team’s performance throughout a project.
Jira has a range of reports that shows the information about your project, versions, sprints, epics, and issues.
Following are the reports generated by report:
Average age report
An average age report shows the average age of unresolved issues for a project or a filter. It helps you to show whether the backlog is kept up-to-date or not.
Basically, it finds the average number of days for which the issues are kept unresolved.
The Average Age report is generated that depends upon the selected project, the type of issue selected in the filter, and time is chosen (hours/days/week/months).
Average age report can be shown as below:
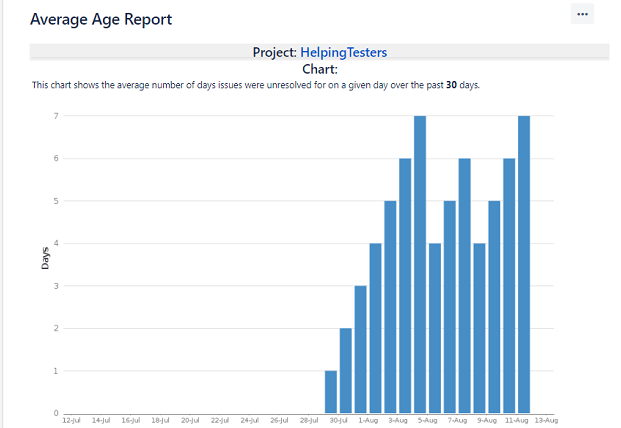
The above screen shows the average age of all the unresolved issues over the past 30 days.
Pie chart
The pie chart displays the issues which are returned from the specified project or an issue filter. We can create an issue filter that retrieves all the issues belonging to a specific version of a particular project. The pie chart is created to group all the issues belonging to a specific statistic type, and statistic type can be Assignee, project, etc.
Suppose I choose the statistic type as Assignee.
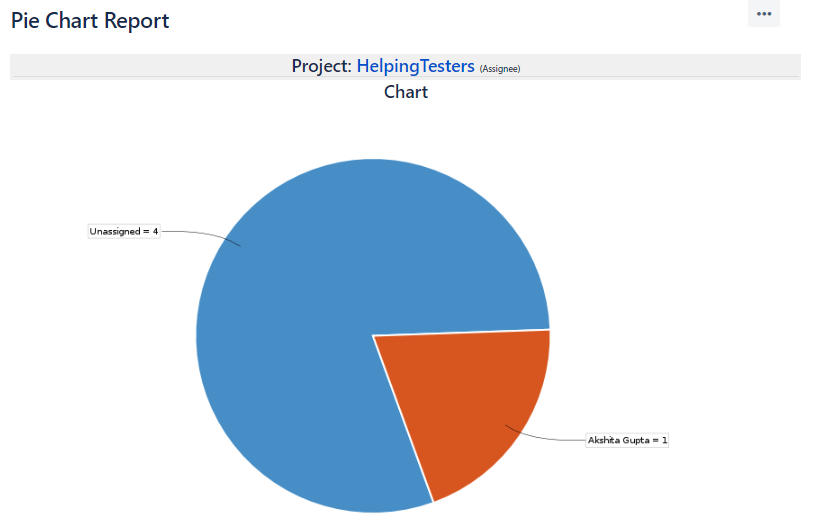
The above screen shows the pie chart based on the “Assignee” type. The above chart shows that the one issue is assigned to the Akshita Gupta, and the other four issues are unassigned.
Created vs. Resolved issue
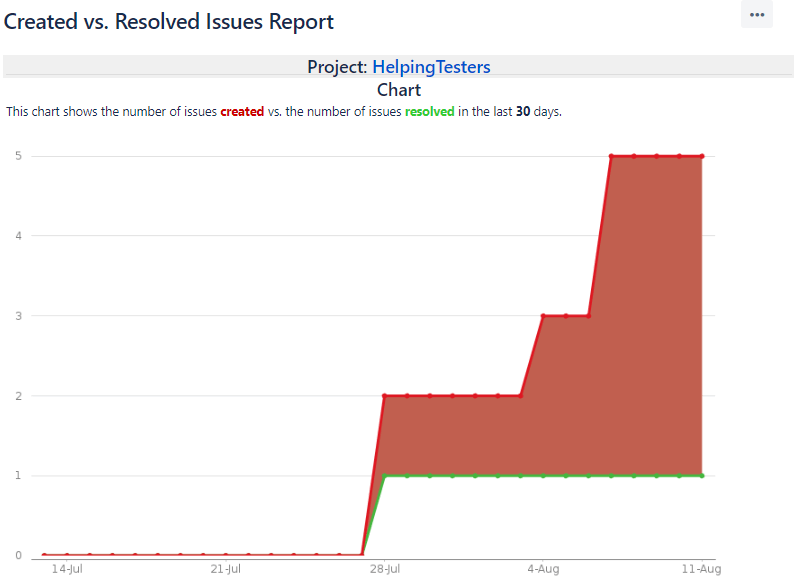
The created vs. resolved issue is a report that displays the number of issues which are created and resolved over a given period of time.
This report is created based on the project and issue filter that the user chooses and the chart can either be cumulative or not.
Recently Created Issues Report
The recently created issues report displays the number of issues that are created, and some of the issues are resolved.
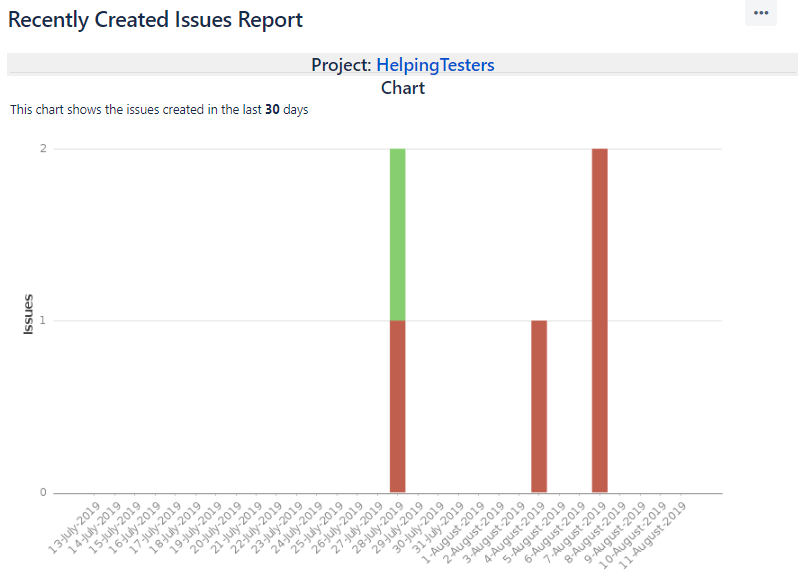
In the above screen, the red portion shows that that issues are created and they are unresolved while the green color shows that the issues are created, but they are resolved.
Resolution Time Report
The resolution time report determines the length of the time taken to resolve the issues for a project/filter.
Single Level Group By Report
Single level group by report categorizes the issues by a particular field for an issue filter, but it does not display the chart.
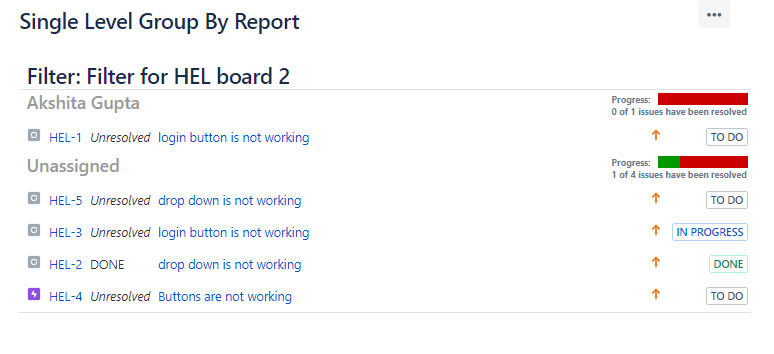
The above screen shows that one issue, i.e., HEL-1, is assigned while other four issues, i.e., HEL-5, HEL-3, HEL-2, HEL-4, are unassigned. The Single Level Group By Report shows the progress of both assigned and unassigned issues.
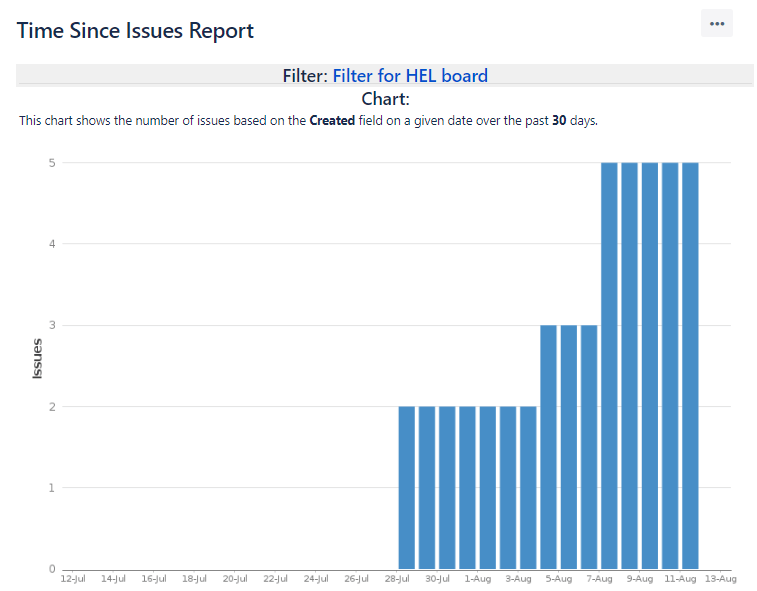
Time Since Issues Report
The Time Since Issues Report generates the report that shows the number of issues for the chosen data field, and the data field can be Created, Updated, Due, Resolved.