Kibana- Aggregation
In this section, we are going to learn about the Aggregation in the Kibana. We will have a brief discussion about the what is aggregation in Kibana, types of Aggregation.
What is aggregation in Kibana?
Aggregation is the key principle for the creation in Kibana of the desired visualisation.
Whenever we do some visualization, we have to define the parameters, which means how we want to group the data to perform the metric on it.
In this tutorial, we are going to discuss the two basic types of aggregations that we have:
- The Bucket Aggregation
- The Metric Aggregation
Bucket Aggregation
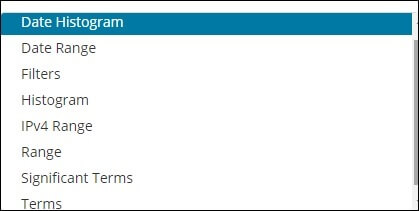
A bucket consists of a key and a text. When conducting the Aggregation, the documents are put in the respective container. We can see the list of Bucket Aggregation when making visualization in Kibana below.
The fields on the index are country name, city, population, region. We have the country name along with its population, region and area in the country details.
Suppose we want wise data from the area. Then the countries available in and area become our search query, so in this case, our buckets will be created by the country.
The diagram below shows us that there are some of the buckets like R1, R2, R3, R4, R5, R6 and then after the transformation, we got the c1, c2, c3, which are the part of the R1 to R6 bucket.
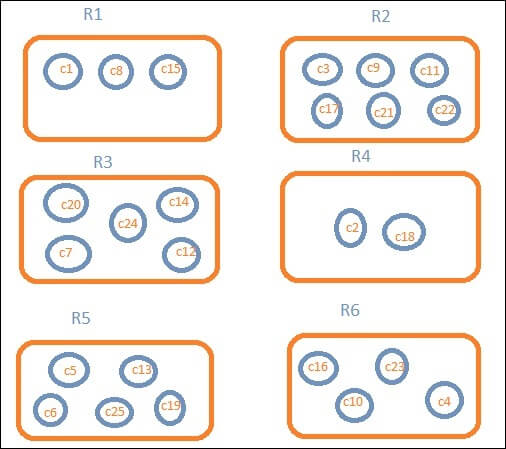
We can see that in each bucket, there are several circles. They are simply the clusters of the data that fall inside the search criteria. We’ve got documents c1, c8, and c15 in bucket R1. These documents are the countries that fall, the same for others, into that area. If we count the countries in Bucket R1, it’s 3, 6 in R2, 6 in R3, 2 in R4, 5 in R5 and 4 in R6.
The bucket aggregation options that we have are:
- The Date Histogram Aggregation
- The Date Range Aggregation
- The Filters Aggregation
- The Histogram Aggregation
- The IPv4 Range Aggregation
- The Range Aggregation
- The Significant Terms Aggregation
- The Terms Aggregation
Date Histogram Aggregation
Aggregation of Date Histogram is used on a date field. Therefore, the index we use to represent can be used if we have a date field in that index than this form of Aggregation. This is a multi-bucket aggregation, which means that as a member of more than 1 bucket, we will have any of the documents. For this aggregation function to work, we can also use the reference image below.
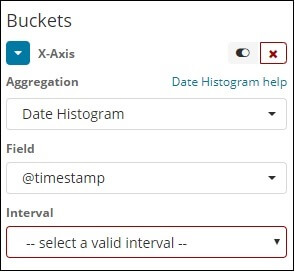
When we select the Aggregation option as Date Histogram, the Field option will be displayed, that will only provide the fields relevant to the date. After selecting our sector, select the interval with the following information:
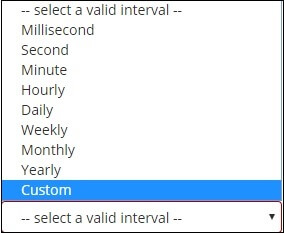
Thus the documents selected from the index will categorize the documents in buckets based on the field and interval chosen. For eg, if we choose the period as monthly, the date-related documents will be translated to buckets and will be placed in the buckets related on the month, i.e., Jan-Dec. Here the buckets will be Jan, Feb, .. Dec.
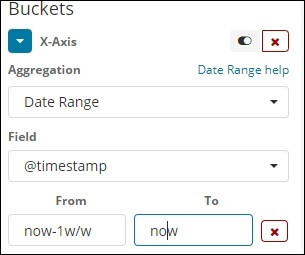
Date Range Aggregation
To use that method of Aggregation, we need a date field. Here we have a date set, which is to be given from date and up to date. The buckets will have their documents based on the given form and to date.
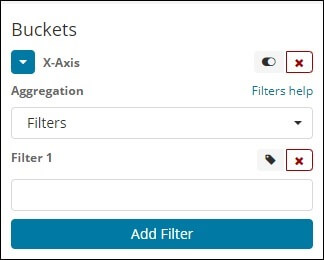
Filters Aggregation
The buckets will be created with Filters like Aggregation based on the source. Here we can get a multi-bucket shaped as one document can reside in one or more buckets, depending on the filter criteria.
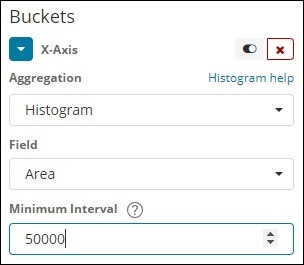
Histogram Aggregation
It is the range that is applied to a range of area or a range of the numbers and then the dataset will be clustered in the different group based on the range.
IPv4 Range Aggregation
This kind of Aggregation is used and used mostly for IP addresses.
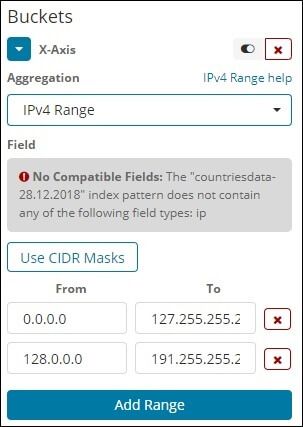
The index we have that is the contriesdata-28.12.2018 has no form IP field, so it shows a message as shown above. If we happen to have the IP field, as shown above we may specify the values From and To in it.
Range Aggregation
This type of aggregation function consists of the number field that must be filled with a rage of numbers.
We can also add more ranges or range field if it is required.
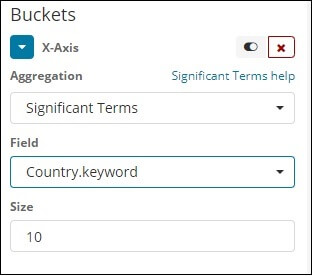
Significant Terms Aggregation
This kind of Aggregation is often seen in the fields of strings.
Terms
We use this type of aggregation method on all the fields that are available, for example, they can be date, Boolean, string address, number, timestamp, IP etc.
This type of aggregation functions is used widely all over the places in the different type of data set.
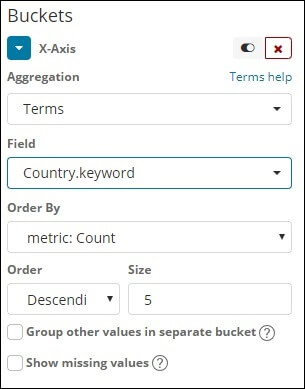
We have an choice order whereby we group the data according to the metric we choose. The size refers to the amount of buckets in the diagram we want to view.
Metric Aggregation
Metric Aggregation applies specifically to the measurement of maths carried out on the documents contained in the container.
The image below shows us the metric aggregations that we can implement in our software.
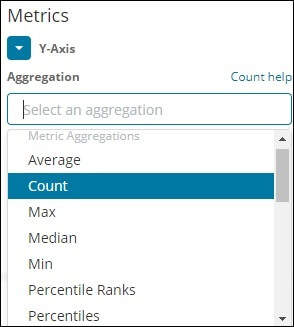
Here we will discuss the few important aggregation function that will be used highly in our software.
- The Average function or operation
- The Count function or operation
- The Max function or operation
- The Min function or operation
- The Sum function or operation
The given metric will be applied to all of the individual items that are present in the bucket of the aggression. It was the same thing that we discussed earlier.
Next, let us analyze the list of aggregated metrics here:
Average
This will provide the average of documents present in the buckets for the values. For example:

The Buckets that we have named are from R1 to R6. We do have c1,c8 and c15 in R1. Consider c1 being 300, c8 is500, and c15 being 700. Now to get an average R1 seal value
R1 = value of c1 + value of c8 + value of c15 / 3 = 300 + 500 + 700 / 3 = 500.
For bucket R1, the average is 500.
Count
The count of documents present in the Bucket will be given this. Suppose if we want to count the number of countries in the region, then this would be the total documents in our buckets. For instance, R1 will be 3, R2 = 6, R3 = 5, R4 = 2, R5 = 5, R6 = 4.
Max
This will give the document’s total value present in the container. Considering the example above if we have data from area wise countries in the bucket field. The max shall be the country with the highest area for each nation. So every area will have one nation, i.e., R1-R6.
in
This will give the document present in the bucket a min value. Considering the example above if we have data from area wise countries in the bucket field. The min is the country with the minimum area for each zone. So every area will have one nation, i.e., R1-R6.
Sum
This gives the sum of the document ‘s values present in the container. For example, if we want the total area or countries in the country, if we consider the above case, it would be the sum of the documents present in the country.
In case we have region-wide documents from R1 to R6, the country-wise area will be summarized for the region.