Kibana Elk Stack
In this section, we are going to learn about the Elk stack. What is it? How to use Logstash with the Kibana, loading of data in Kibana, how to load the data using the .csv file format in the Kibana.
Kibana is an open-source visualization application used mainly for analyzing a large volume of logs in the form of the line graph, bar graph, pie charts, heatmaps, etc. Kibana works in sync with Elasticsearch and Logstash, which form the so-called ELK Stack together.
ELK stands for Elasticsearch, Kibana, and Logstash. ELK is one of the popular log management platforms used for log analysis around the world.
ELK Stack –
- Logstash extracts data from various input sources for the logging or other events. And in the processing of the data in the Elasticsearch, the events are processed first and then on the later process they are stored.
- Kibana is a visualization application that accesses Elasticsearch logs and shows line graphs, bar graphs, pie charts, etc. to the user.
We are going to work very closely with the Kibana application and the Elasticsearch in this tutorial so that we can represent our data in various ways with the help of the different visualizations.
Let’s understand that how we can work together with ELK stack. Also, we will learn about the loading of the CSV data from our Logstash to the Elasticsearch.
Load CSV data from Logstash to Elasticsearch
In Kibana, we are going to use the format of the .CSV data to upload it into the Elasticsearch by using the Logstash. To get the data, we have used the popular data collection websites, Kaggle, so that we can analysis dummy data.
From the specified website, we have picked countries data by using the link https://www.kaggle.com/fernandol/countries-of-the-world. It downloads the countrydata.csv file. Now, we can use the CSV-file for analysis.
The CSV file contains the following information:
File name ? countriesdata.csv
Columns ? “Country”,”Region”,”Population”,”Area”
We can also build and use a dummy CSV script, too. We can use logstash to dump this data into elasticsearch from countrydata.csv.
Let’s start the terminal with Elasticsearch and Kibana, and keep it running. We need to build the Logstash config file with details of the CSV file columns and other information, as shown in the logstash-config file below.
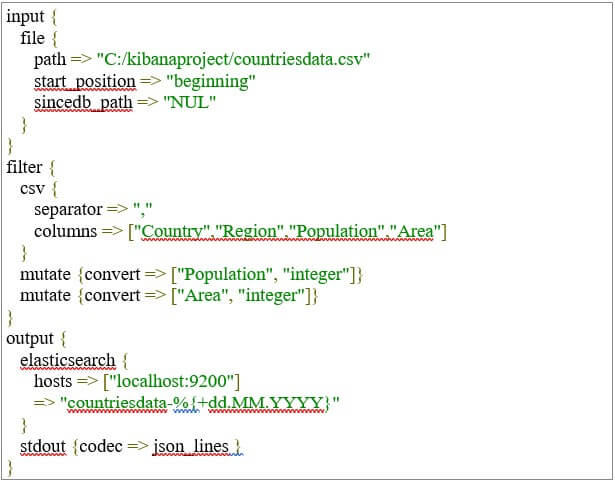
We have created 2 components in the config file:
Input
We need to specify the input file path, which is a CSV file in our case. We give the path by using which we store the CSV file in our Kibana in the path field option.
Output
We need to specify where the data is to be put for output. Here, we use Elasticsearch, in our case. The next field is the index we gave the name as the current nation. Once the data is updated in Elasticsearch, we must use the same index in Kibana.
Now we need to save the above file in the Kibana as the configuration file, which will be named as Logstash countries.config. Note that in the next step, we must send this config path to Logstash order.
Now for our data that we inserted in the Kibana to work properly, we need to restart our Elasticsearch server so that it can load data from the CSV file to our server.
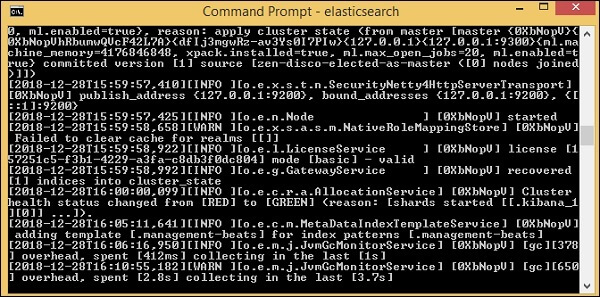
Now run http:/localhost:9200 to confirm whether elasticsearch is running successfully in the browser.
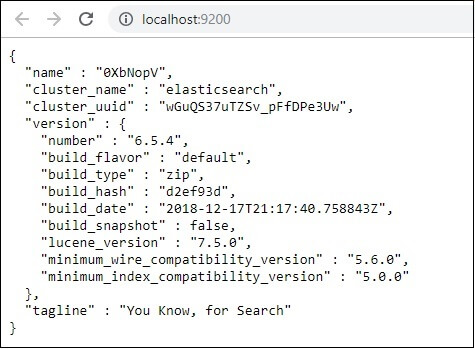
We do run Elasticsearch. Now moving forward, we must go to the path where we are going install the logstash, and then we must execute the following given command in the CMD so that it can upload the following data into the Elasticsearch.
—–logstash -f logstash_countries.conf
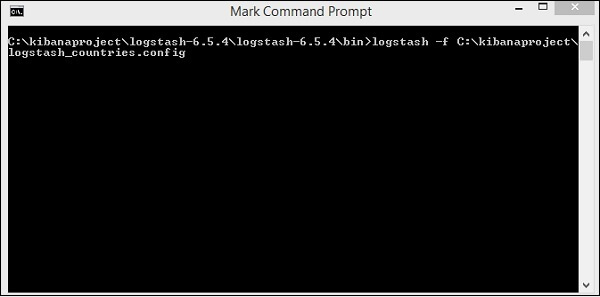
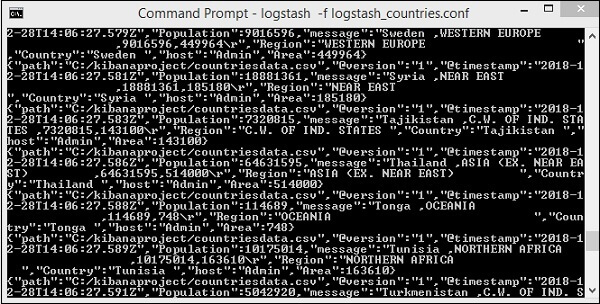
In the above image, we can see that the data is loading from the CSV file into the Elasticsearch. To know if we have the Elasticsearch index, we can check it the same way.
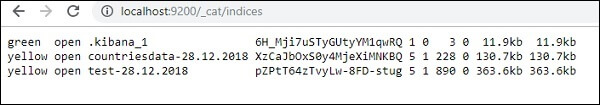
As shown above, we can see the countrydata-28.12.2018 index established.
Now, The index information ? Länder-28.12.2018 are as follows:
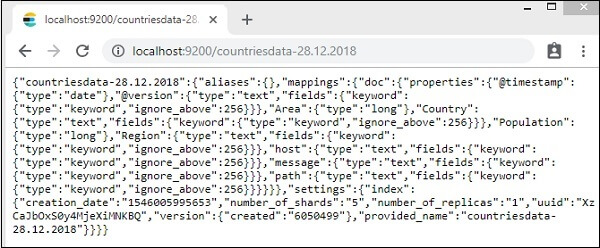
Remember that when data is uploaded from logstash to elasticsearch, the mapping details are generated with properties.
Use Data from Elasticsearch in Kibana
The Kibana is currently running on the localhost on the port 5601(This port can be different in the case of different users) ? http:/localhost:5601.
The User Interface of the Kibana can be seen in the image below.
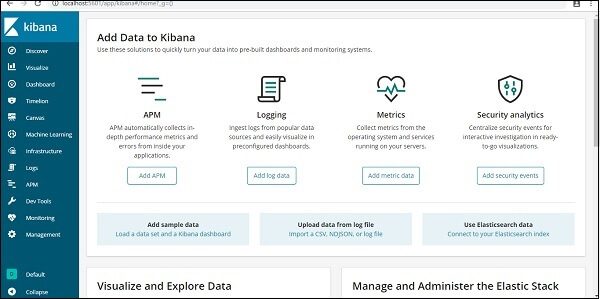
There is a point to note before we move forward with the steps further than we have already installed and configured the Kibana in our application. It is linked to the Elasticsearch, and within Kibana, we should be able to see index: countries-28.12.2018.
Click on the Management Menu option in the Kibana UI on the left:
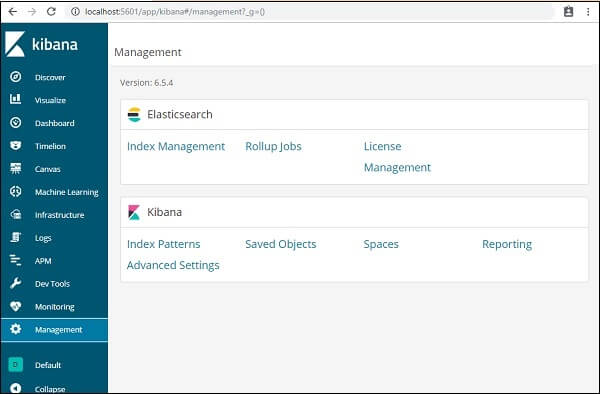
Now, click on the Index Management:
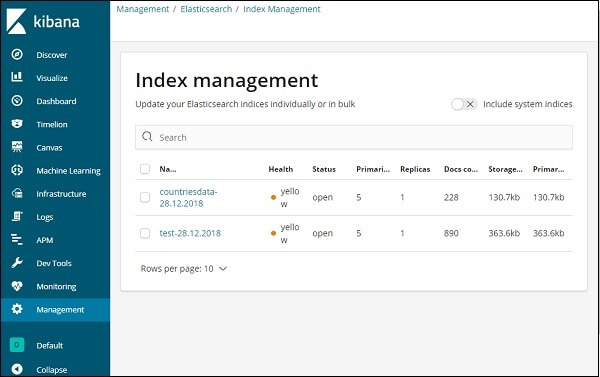
In index management, the indices present in Elasticsearch are shown.
In the next section, we will understand how we can use Kibana ‘s index on our data set to visualize the data or to convert the data in the form of pie chart, bar graph, line chart, etc. to get the better output from of data.