Linear Regression Summary table in SPSS
In this section, we will learn about the remaining table of Linear regression. We will learn about the ANOVA table and the Coefficient table. Both the tables are given below:
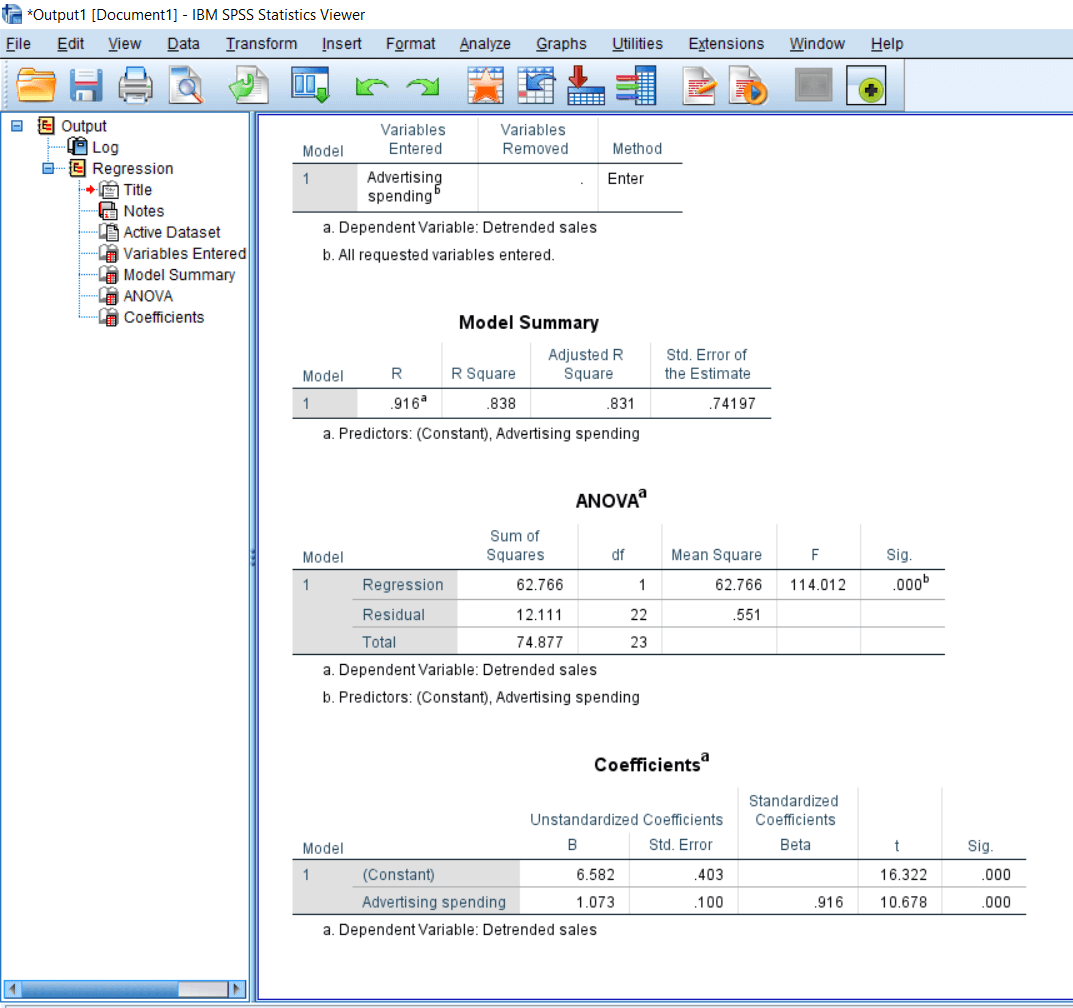
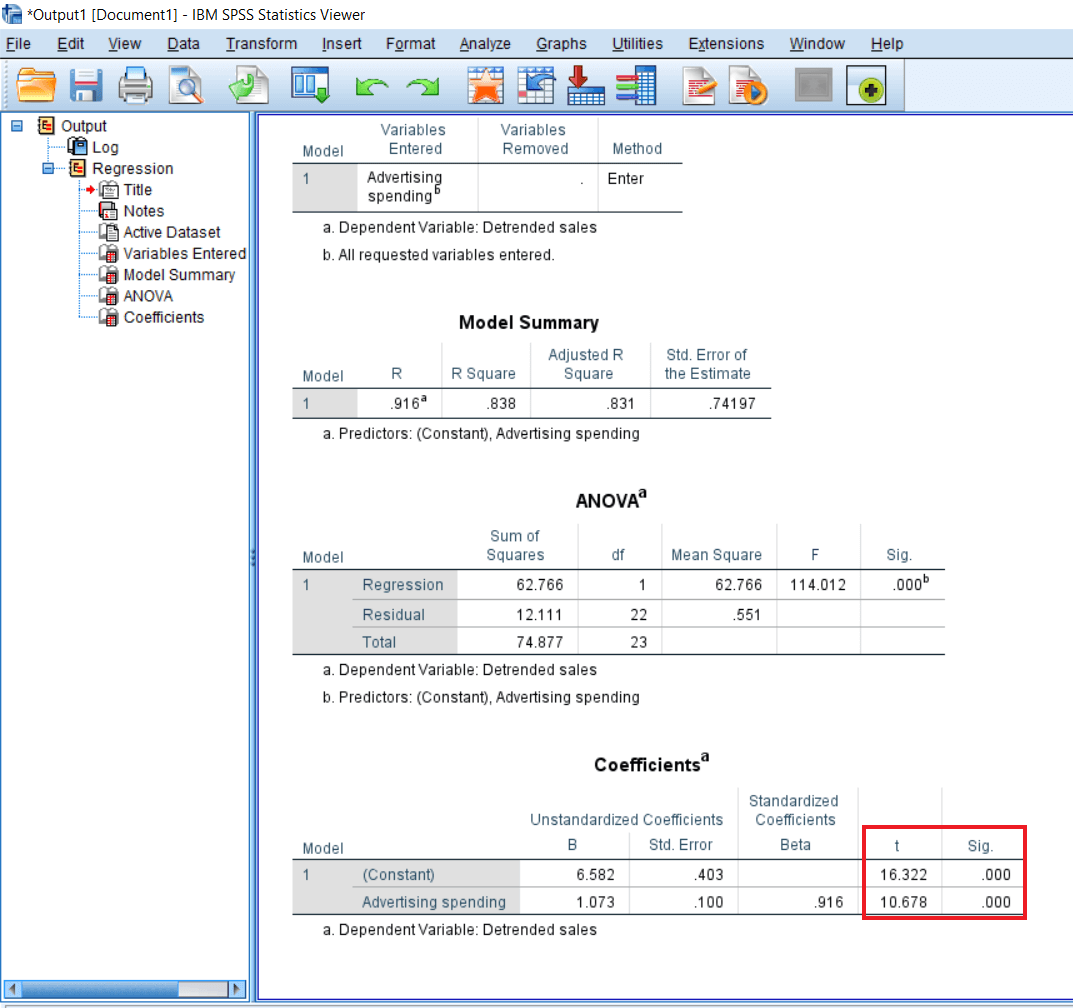
First, we will learn about the ANOVA summary table. While we calculate the linear regression, we will get an ANOVA summary table because ANOVA is essentially a precursor to cause and effect analysis or linear modeling. In case, we are looking for a cause and effect analysis, and if we divide the influence of independent variable into many categories or many levels like a lower level of Iv (Independent variable), medium level of Iv and high level of Iv, and if these three levels of Iv have a significant influence on the dependent variable, then it’s worthwhile to look for an actual regression equation. So, in this case, different levels of Independent variables are being compared, and we have found that this influence is significant in the ANOVA table. Keep this in mind that for the linear regression equation to be valid, this ANOVA should be significant, and R square should be sufficiently high. So our ANOVA is significant. It means we are good to go for the linear regression analysis, and that is our last table for the outcome.
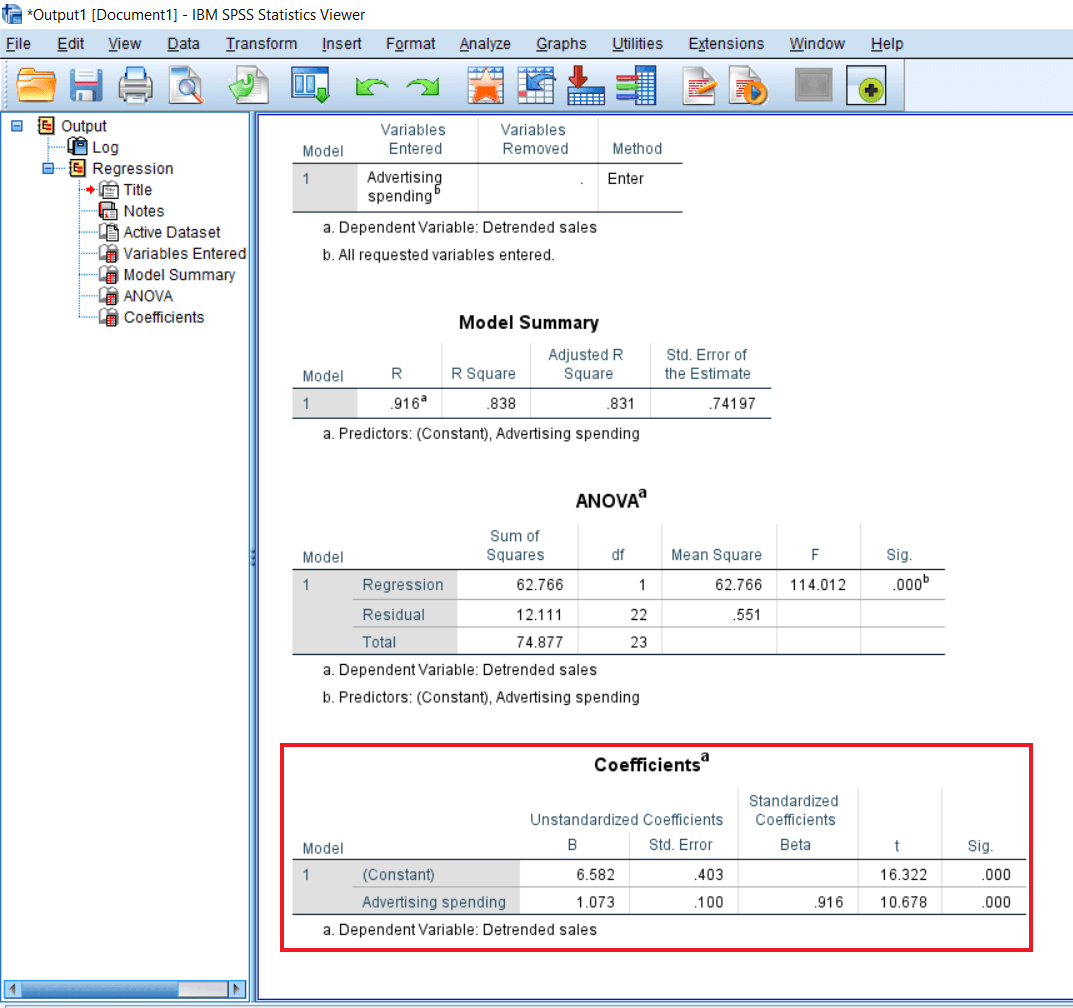
The last table gives us a Constant value, and then we have the value of the unstandardized coefficients that are the B and with its standard error. After that, we have the standardized coefficient value that is the Beta.
The variables we have are Constant and Advertising spending. So B and Beta are slightly different in terms of the kind of units that are used to report them. B is unit free. For example, if we spend on the advertisement, it might be in terms of dollars or our local currency. So if we report this effect, we will say that independent variables are measured in local units. One unit of the independent variable, measured in the local unit, has a 1.073 unit of positive influence on the dependent variable.
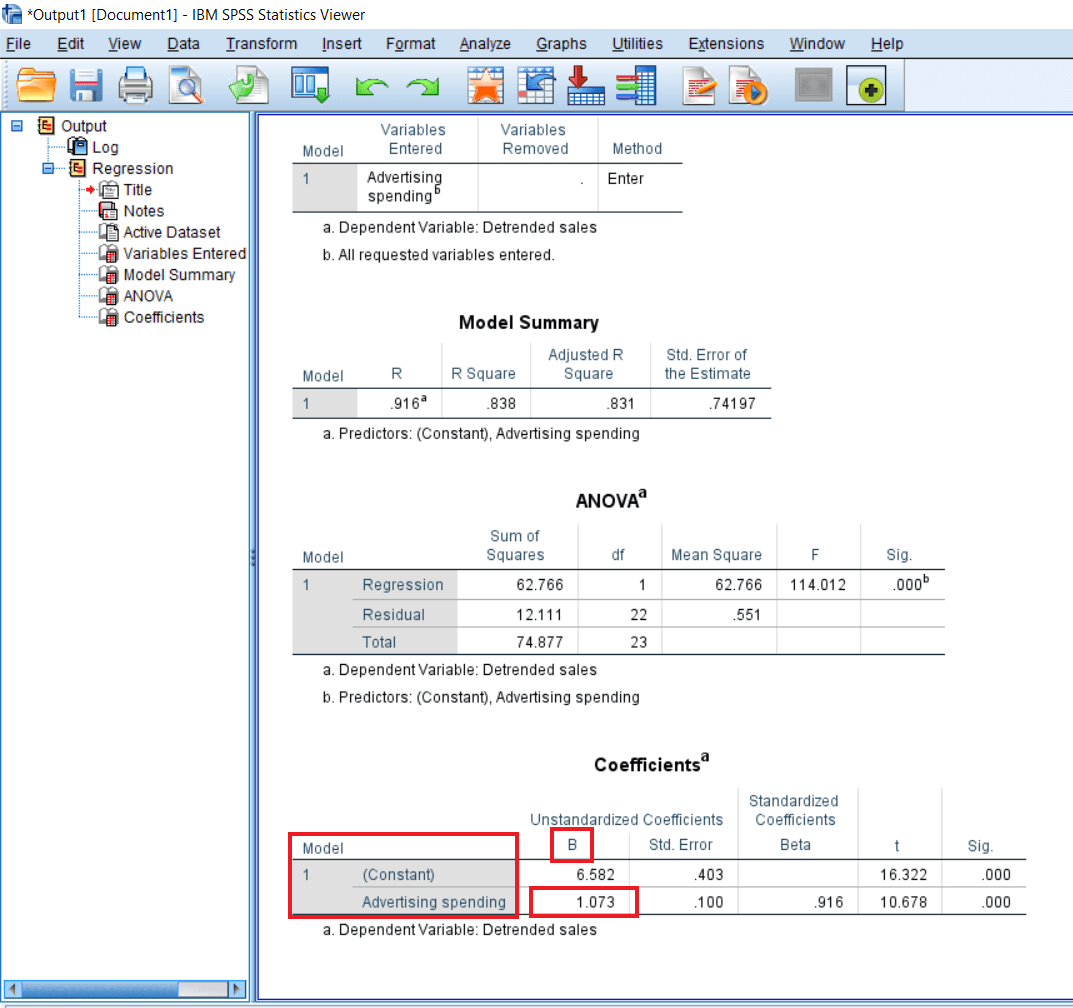
It means advertisement has a positive influence on the dependent variable, and we are just indicating the result in the local currency. For example, advertisement spending has not been reported, like in which currency the spending has been measured.
So maybe we are having thousands of dollars or something we are not aware of it. Even in this case, when we are not aware of the currency and unit, we can say that 1 unit spending in advertisement leads to 1.073 increases in sales. So we are getting an almost equal amount of increase in sales for the advertisement spending in the case of B and Beta.

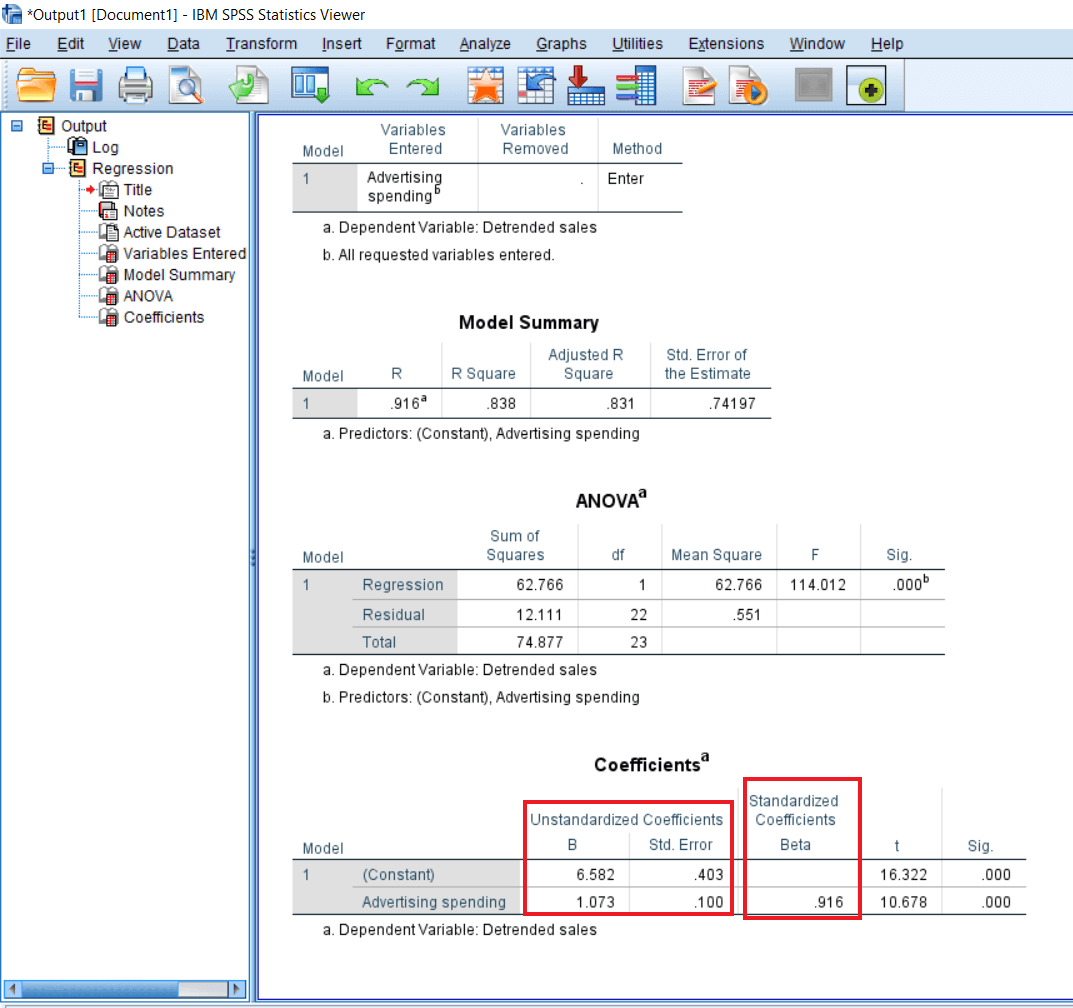
Beta is free from any unit. So beta is measured or reported in terms of standard deviation. In this case, we will say that one standard deviation change in the advertisement spending will cause a .916 standard deviation change in sales.

So again, this influence is positive. The difference between B and Beta is that Beta is neutral, and it is not any local unit or currency, and B is always in terms of a local unit or the currency. So, the standard way of reporting the linear regression outcome is Beta. We generally don’t report the B unless or until we are creating the table as well. In the tables, we can report B as well as the beta. But in the case of statements, we report only the standard beta coefficient.

Then we have the t statistics here. T-test measures that whatever influences we have got, whether they are significantly different from zero. So that’s very important. So we might be having a non-significant difference as compared to a null number. So that influence is accounted by using the t stat, and t stat is again highly significant.
So we can say, all in all, advertisement spending has a positive influence on sales. In fact, one standard deviation change in advertisement spending leads to a .916 standard deviation change in the sale.