Output of Linear Regression
In this section, we are going to learn the Output of Linear Regression. The output of linear regression is as follows:
These are the tables that have been created by default. Since we have not selected any option from our side. So, it means these are the essential tables whenever we do a linear regression analysis. Now we will understand all the tables one by one. The first table is a simple descriptor table that tells us about our model.
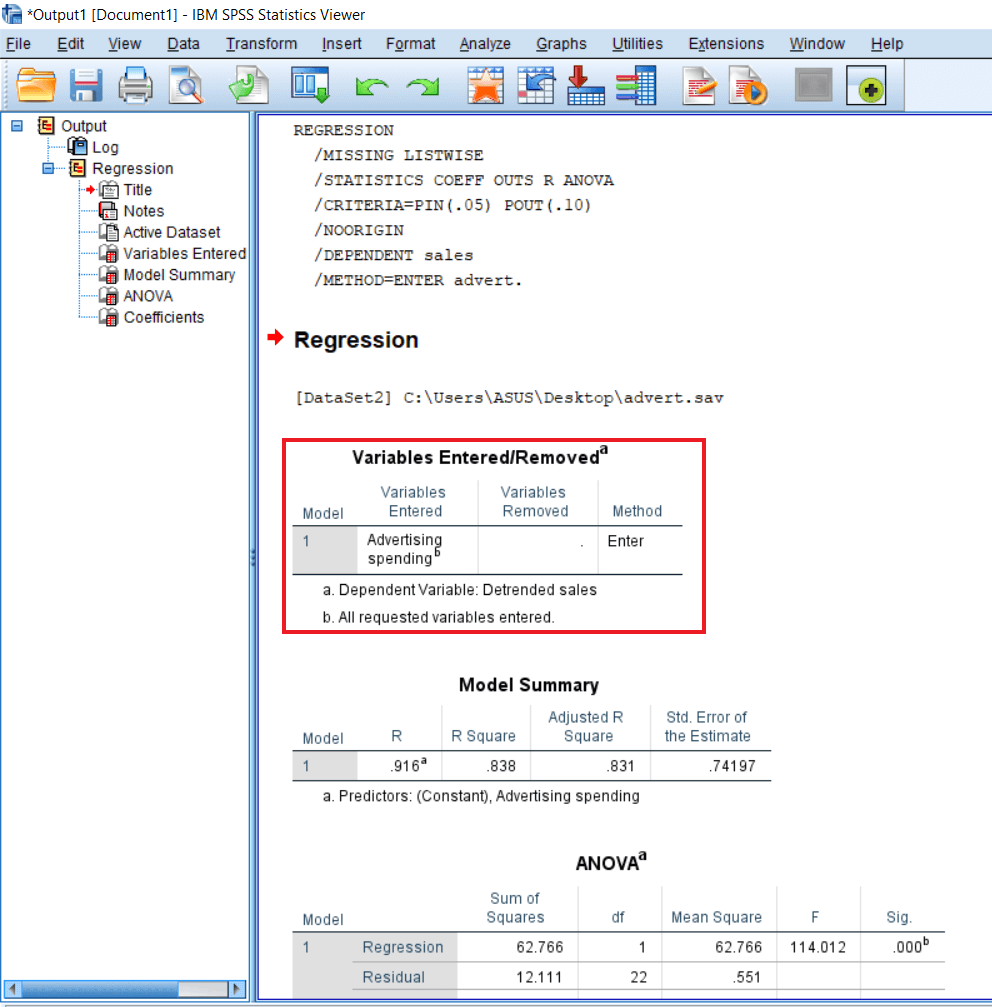
In the above image, we can see that under the Model, only 1 is written. It is because we are taking only one variable, and we have built only one model, and the model is where advertisement influences sales. Suppose there had been more variables, and we wanted to see a separate advertisement role and the market condition on sales. So we could have built using block options and other models. So, in that case, we have got two models. But currently, we have one model.
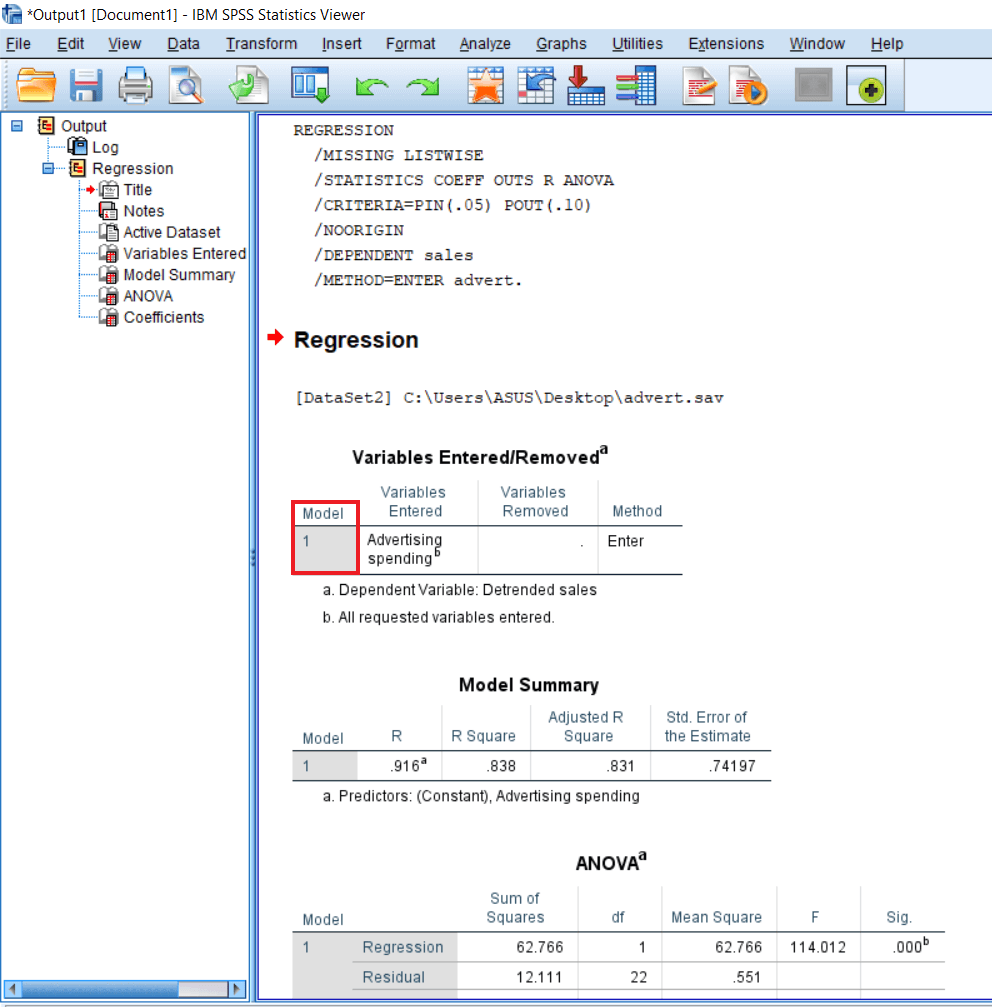
The variables that we have taken in our study are advertisement and spending. So these are the two variables. The Dependent variable is detrended sales, and all requested variables are entered. Since we have used the enter method, all the variables are given equal importance in the case of the enter method. All the variables are entered. It means all the variables have been entered in this regression equation.
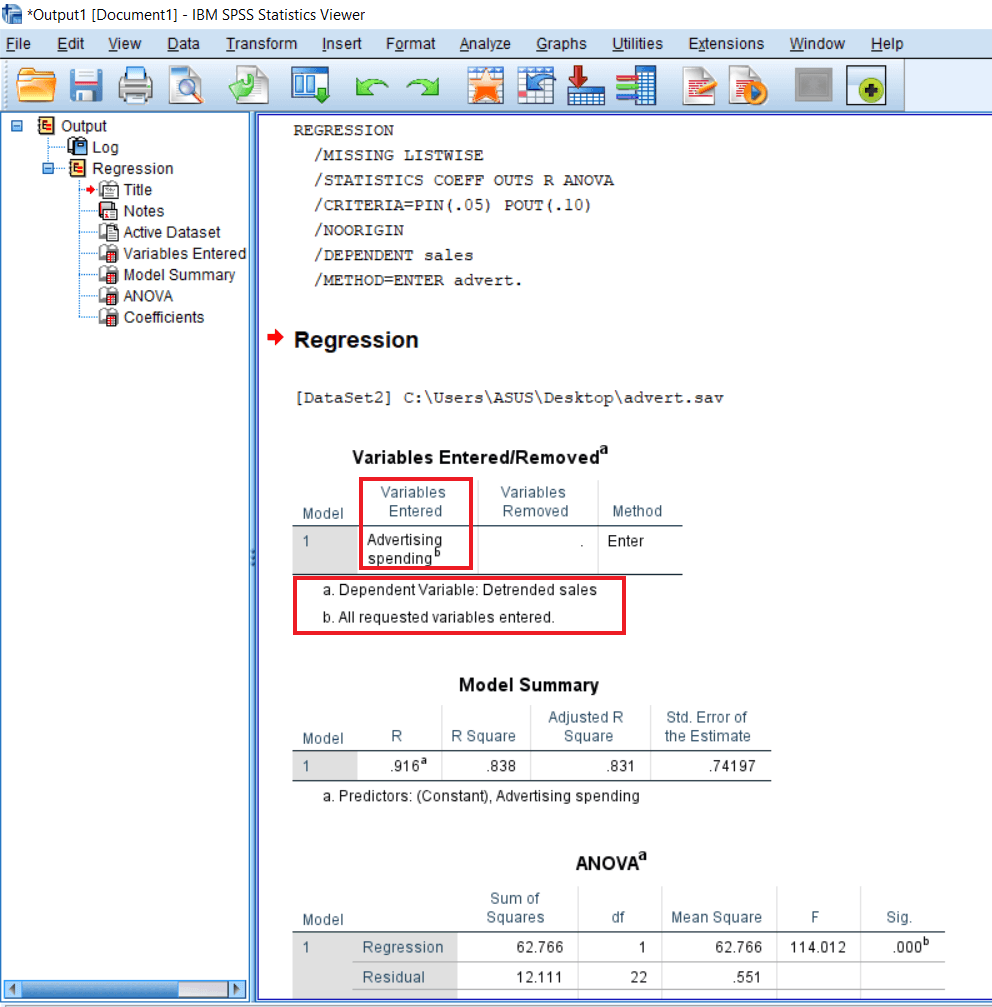
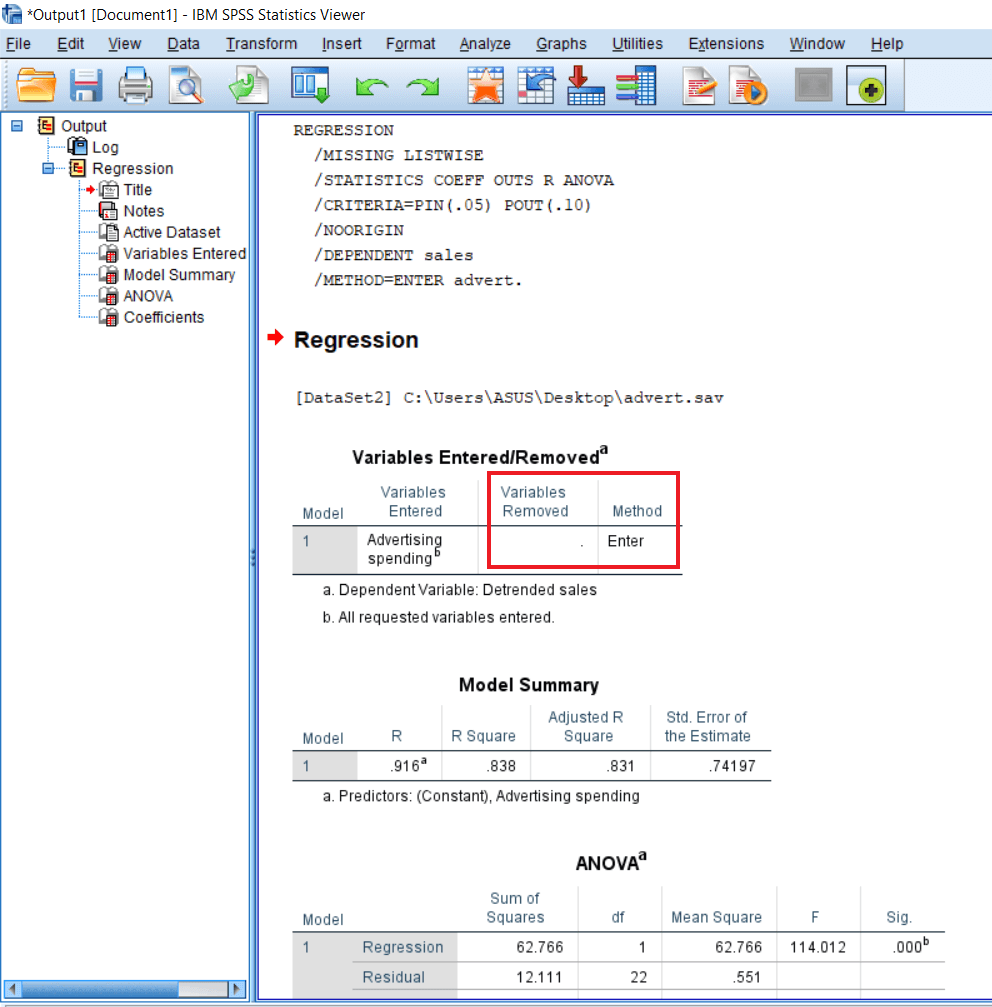
We have not removed any variables. That’s why Variable Removed field is blank. The method for doing regression is the Enter method.
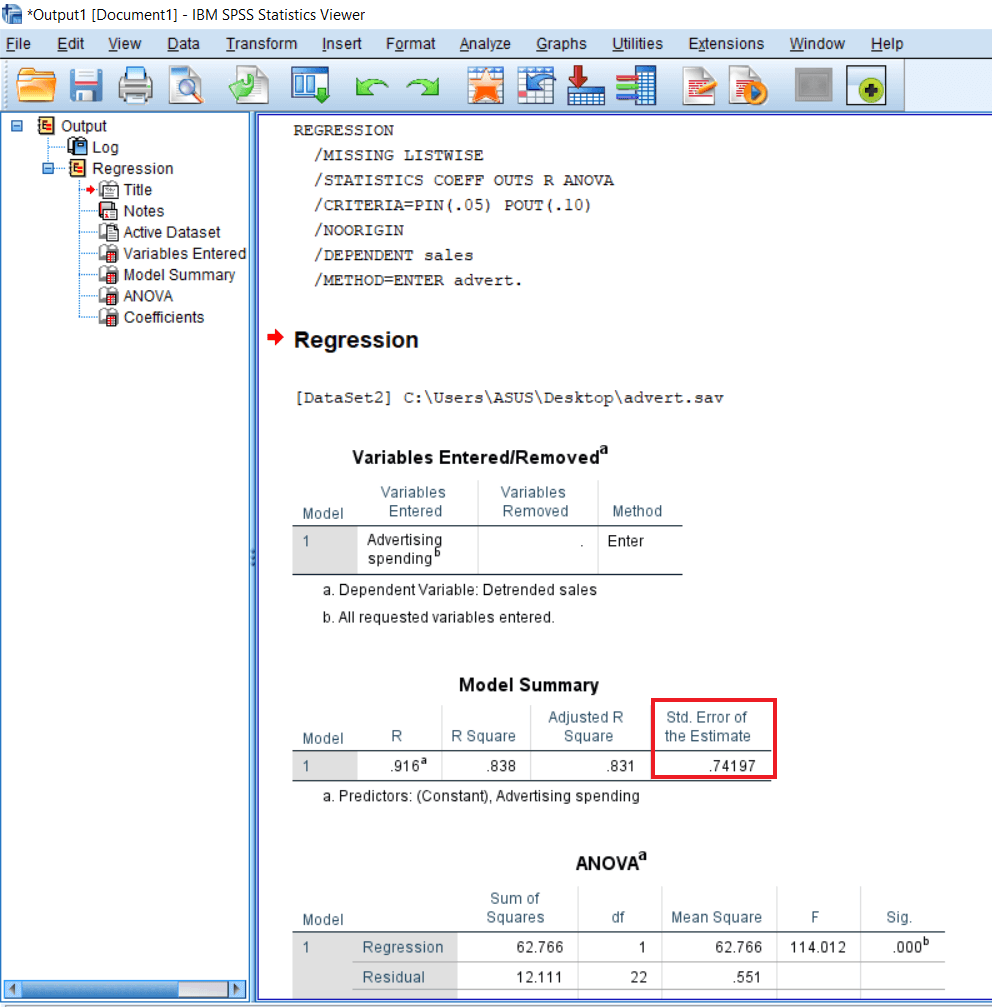
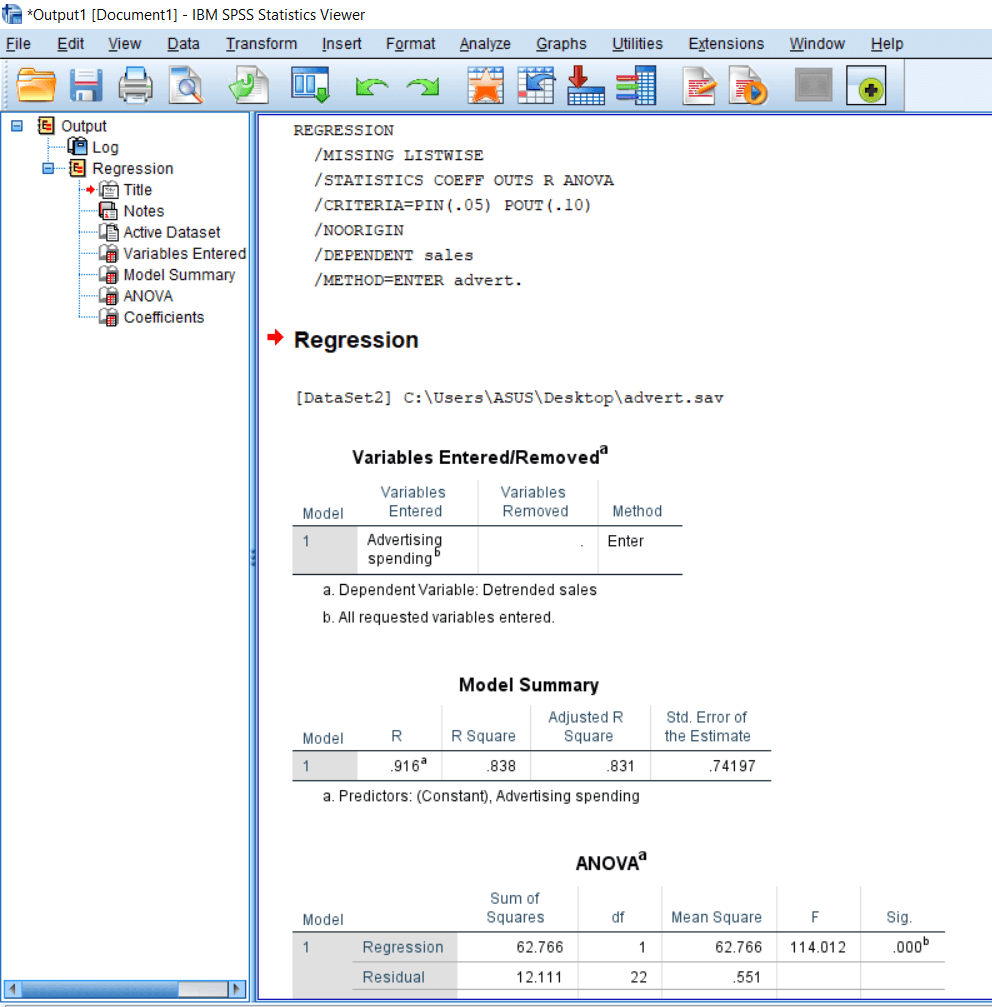
So that’s the descriptive table and is not of use for the reporting purpose. But it’s good to understand them. Then we have a Model summary table like this:
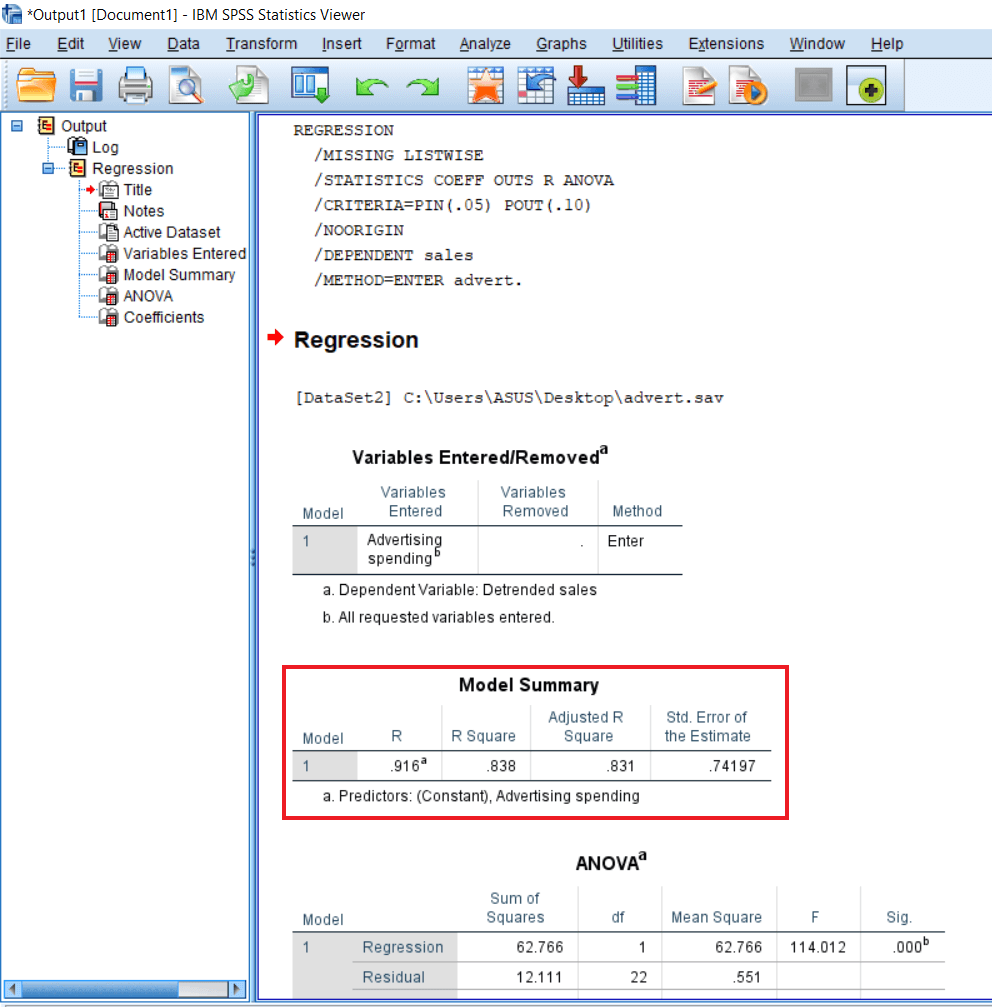
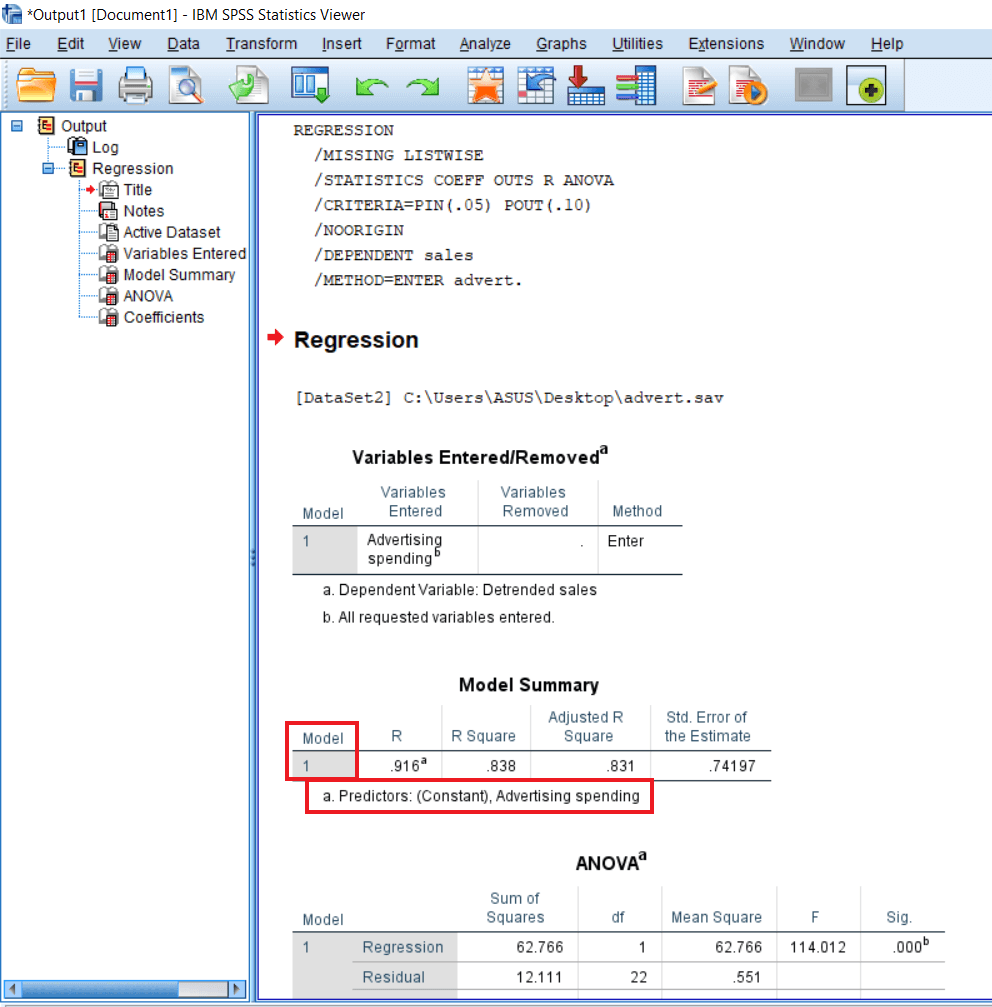
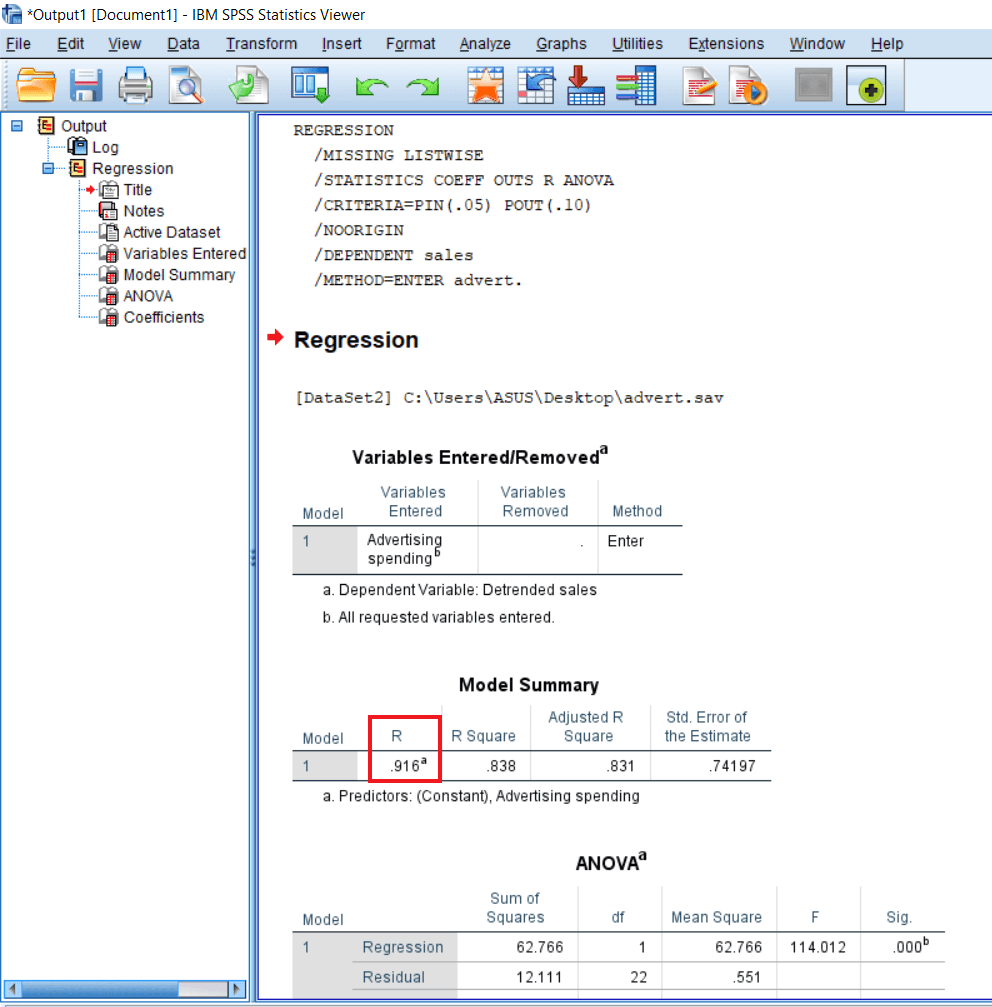
In the model summary, we have one model again, and our predictor is Constant and advertising spending. So we have only one variable practically.
Now we have the R, which refers to the correlation between variables. It is important to report correlation in case of regression because we can presume one variable to influence another variable if they are correlated. If there is no relationship between the variable, we will look for a cause and effect relationship. A correlation does not guarantee the cause and effect relationship, but the correlation is required for the cause and effect relationship.
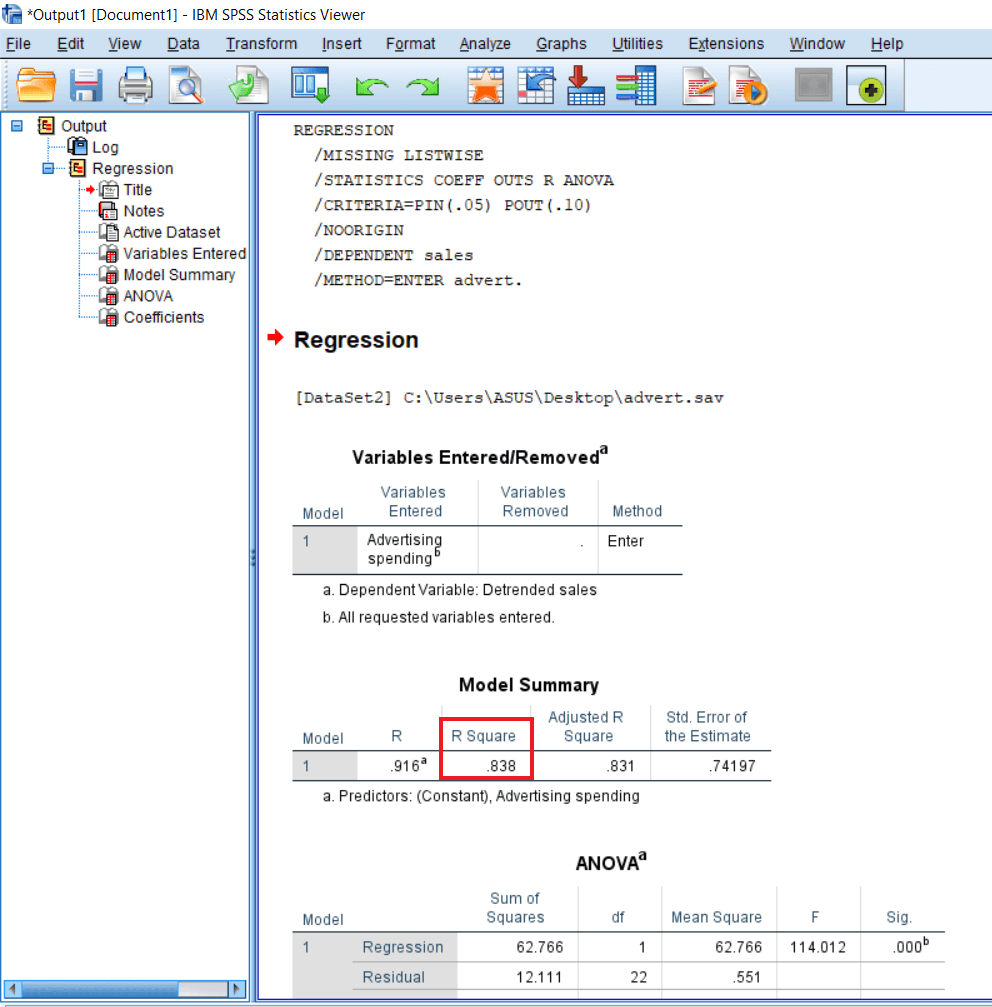
Then we have another measure, and that is known as the R square. So, R square is the measure of total influence of all independent variables on dependent variables. We can interpret R square as a percentage of influence explained by the independent variables in the dependent variables. So, our independent variable is advertisement spending, and the dependent variable is sales. It means advertisement spending can explain 83.8% of sales. It means that a large amount of sales is basically being created or influenced by the advertisement variable. So, advertisement is an important variable for sales.
After that, we have adjusted R square. Adjusted R square is a statistic that is used in case we are creating a non-parsimonies model. The idea is that when we create a model or regression equation, in that case, we should select all necessary variables. But if we select any unnecessary variable, there should be a penalty for that. That’s why we don’t create a long list of unnecessary variables. If we find that and we want to study any dependent variable, there can be infinite independent variables explaining it. But our task is to take only those variables which significantly cause the dependent variable. That’s why we have the adjusted R square. It’s good to report if we are having a large number of independent variables. Since, in our case, we have only one independent variable. The gap between R square and adjusted R square is not much different. R square is .838, and the adjusted R square is .831. So the reduction is only of point .007 that is negligent.
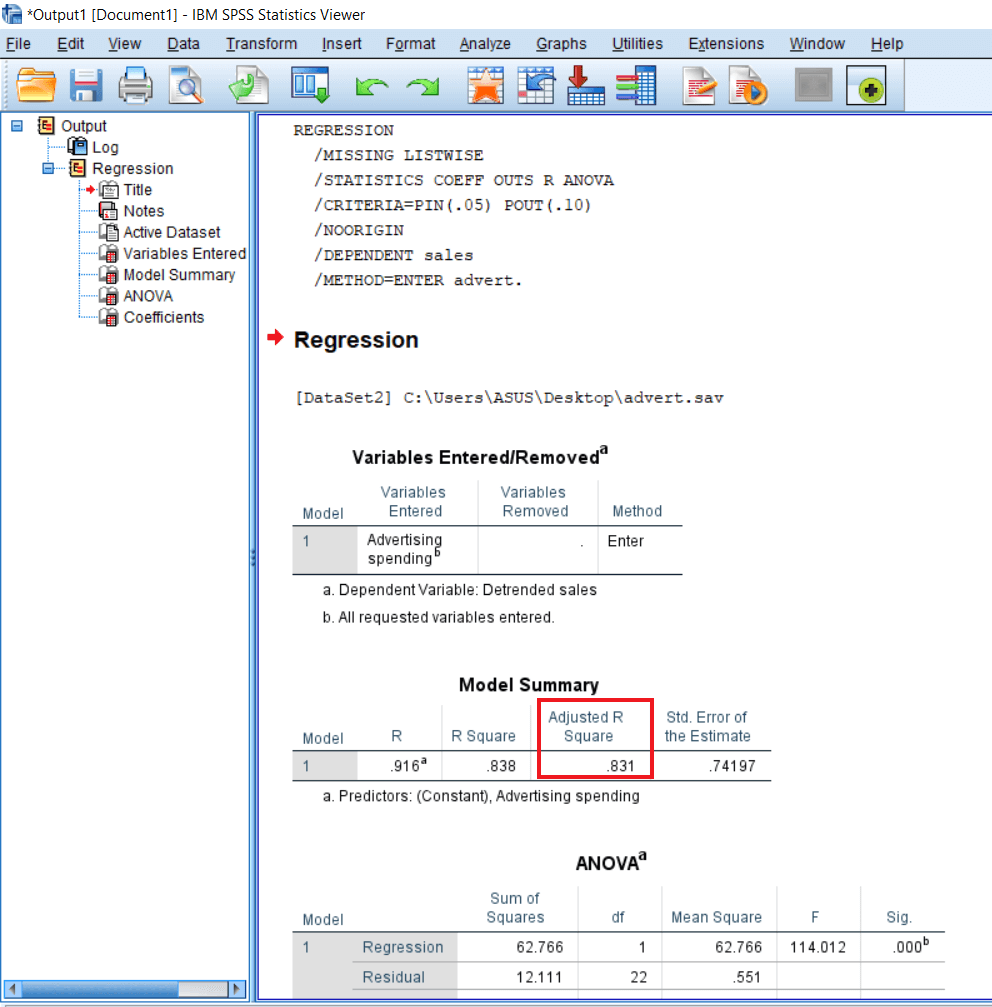
The standard error of the estimate indicates the amount of error in prediction, which is quite small, i.e., .741.