R-Multiple Linear Regression
Multiple linear regression is the extension of the simple linear regression, which is used to predict the outcome variable (y) based on multiple distinct predictor variables (x). With the help of three predictor variables (x1, x2, x3), the prediction of y is expressed using the following equation:
y=b0+b1*x1+b2*x2+b3*x3
The “b” values represent the regression weights. They measure the association between the outcome and the predictor variables. “
Or
Multiple linear regression is the extension of linear regression in the relationship between more than two variables. In simple linear regression, we have one predictor and one response variable. But in multiple regressions, we have more than one predictor variable and one response variable.
There is the following general mathematical equation for multiple regression –
y=b0+b1*x1+b2*x2+b3*x3+⋯bn*xn
Here,
- y is a response variable.
- b0, b1, b2…bn are the coefficients.
- x1, x2, …xn are the predictor variables.
In R, we create the regression model with the help of the lm() function. The model will determine the value of the coefficients with the help of the input data. We can predict the value of the response variable for the set of predictor variables using these coefficients.
There is the following syntax of lm() function in multiple regression
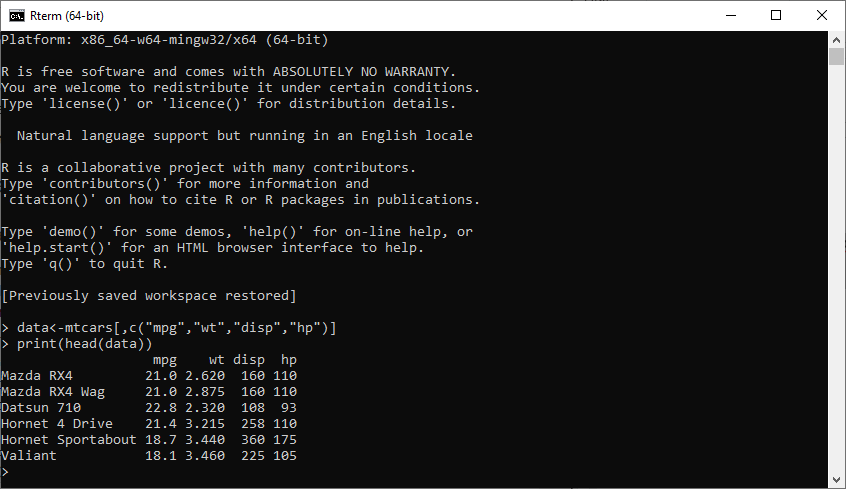
Before proceeding further, we first create our data for multiple regression. We will use the “mtcars” dataset present in the R environment. The main task of the model is to create the relationship between the “mpg” as a response variable with “wt”, “disp” and “hp” as predictor variables.
For this purpose, we will create a subset of these variables from the “mtcars” dataset.
Output:
Creating Relationship Model and finding Coefficient
Now, we will use the data which we have created before to create the Relationship Model. We will use the lm() function, which takes two parameters i.e., formula and data. Let’s start understanding how the lm() function is used to create the Relationship Model.
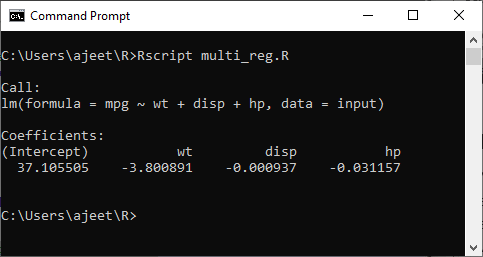
Example
Output:
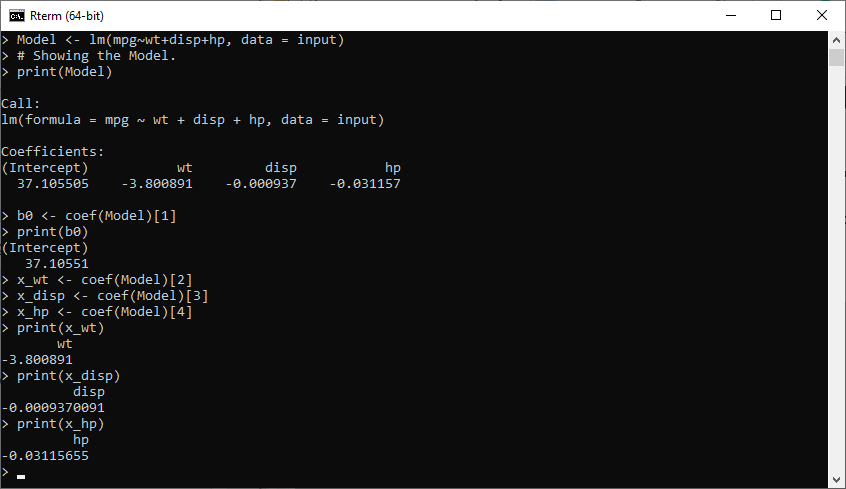
From the above output it is clear that our model is successfully setup. Now, our next step is to find the coefficient with the help of the model.
b0<- coef(Model)[1] print(b0) x_wt<- coef(Model)[2] x_disp<- coef(Model)[3] x_hp<- coef(Model)[4] print(x_wt) print(x_disp) print(x_hp)
Output:
The equation for the Regression Model
Now, we have coefficient values and intercept. Let’s start creating a mathematical equation that we will apply for predicting new values. First, we will create an equation, and then we use the equation to predict the mileage when a new set of values for weight, displacement, and horsepower is provided.
Let’s see an example in which we predict the mileage for a car with weight=2.51, disp=211 and hp=82.
Example
Output: