Redundancy and Correlation in Data Mining
In this article, we will learn Redundancy and correlation in data mining with some examples.
What is Data Redundancy?
In data mining, during data integration, many data stores are used. It may lead to data redundancy. An attribute is known as redundant if it can be derived from any set of attributes. Let us consider we have a set of data where there are 20 attributes. Now suppose that out of 20, an attribute can be derived from some of the other set of attributes. Such attributes that can be derived from other sets of attributes are called Redundant attributes. Inconsistencies in attribute or dimension naming may lead to redundancies in the set of data.
Let’s understand this concept with the help of an example.
Suppose we have a data set that has three attributes – pizza_name, is_veg, is_nonveg
- Is_veg is 1; if the selecting pizza is veg else, it is 0.
- Is_nonveg is 1; if the selecting pizza is nonveg else, it is 0.
| Pizza_name | Is_veg | Is_nonveg |
|---|---|---|
| Farm House | 1 | 0 |
| Veg Loaded | 1 | 0 |
| Chicken Sausage | 0 | 1 |
| Non-Veg Supreme | 0 | 1 |
| Chicken Fiesta | 0 | 1 |
| Veg Extravaganza | 1 | 0 |
| Deluxe Veggie | 1 | 0 |
On analyzing the above table, we have found that if a pizza is not veg (i.e., is_veg is 0 selecting the pizza_name), the pizza is surely non-veg (Since there are only two values in the pizza_name output class- Veg and Nonveg). Hence, one of these attributes became redundant. It means that the two attributes are very much related to each other, and one attribute can find the other. So, you can drop either the first or second attribute without any loss of information.
Detection of Data Redundancy
The following method is used to detect the redundancies:
- X2 Test
- Correlation coefficient and covariance
X2 Test
X2 Test is used for qualitative or nominal, or categorical data. It is performed over qualitative data. Let us suppose we have two attributes X and Y, in the set of data. To represent the data tuples, you have to make a contingency table.
The given formula is used for X2 Test.
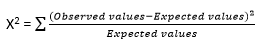
Where,
Observed Values are the actual count.
Expected values are the count acquired from contingency table joint events.
The X2 examines the hypothesis that X and Y are not dependent. If this hypothesis can be rejected, we can assume that X and Y are statistically related to each other, and we can ignore any one of them (either X or Y).
The correlation coefficient for Numeric data
In the case of numeric data, this test is used. In this test, the relation between the A attribute and B attribute is computed by Pearson’s product-moment coefficient, also called the correlation coefficient. A correlation coefficient measures the extent to which the value of one variable changes with another. The best known are Pearson’s and Spearman’s rank-order. The first is used where both variables are continuous, the second where at least one represents a rank.
There are several different correlation coefficients, each of which is appropriate for different types of data. The most common is the Pearson r, used for continuous variables. It is a statistic that measures the degree to which one variable varies in tandem with another. It ranges from -1 to +1. A +1 correlation means that as one variable rises, the other rises proportionally; a -1 correlation means that as one rises, the other falls proportionally. A 0 correlation means that there is no relationship between the movements of the two variables.
The formula used to calculate the numeric data is given below.

Where,
n = number of tuples
ai = value of x in tuple i
bi = value of y in tuple i
From the above discussion, we can say that the greater the correlation coefficient, the more strongly the attributes are correlated to each other, and we can ignore any one of them (either a or b). If the value of the correlation constant is null, the attributes are independent. If the value of the correlation constant is negative, one attribute discourages the other. It means that the value of one attribute increases, then the value of another attribute is decreasing.