98
SciPy Spectrogram
The signal processing toolbox consists of few filtering functions, a limited set of filter design tools. It also contains few B-spline interpolation algorithm for one-and two-dimensional data.
The scipy.signal.spectrogram computes a spectrogram with the consecutive Fourier transforms. Spectrograms can be used as a way of reflecting the change of frequency content of non-signal signals over time.
Output:
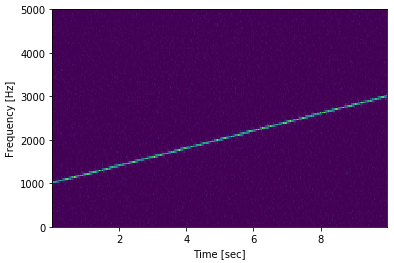
The scipy.signal.spectogram() returns the following array:
f: ndarray
Array of sample frequencies.
t: ndarray
Array of segment times.
Sxx: ndarry
Spectogram of x. By default the last axis of Sxx corresponds to the segment times
Next Topic#