You can use the following basic syntax in seaborn to create a boxplot of multiple columns of a pandas DataFrame:
sns.boxplot(x='variable', y='value', data=df)
The following example shows how to use this syntax in practice.
Example: Boxplot of Multiple Columns Using Seaborn
Suppose we have the following pandas DataFrame that shows the points scored by players on three different basketball teams:
import pandas as pd

#create DataFrame
df = pd.DataFrame({'A': [5, 7, 7, 9, 12, 12],
                   'B': [8, 8, 9, 13, 15, 17],
                   'C': [1, 2, 2, 4, 5, 7]})

#view DataFrame
df

        A	B	C
0	5	8	1
1	7	8	2
2	7	9	2
3	9	13	4
4	12	15	5
5	12	17	7
Suppose we’d like to create three boxplots that show the distribution of points scored by each team.
To create multiple boxplots in seaborn, we must first melt the pandas DataFrame into a long format:
#melt data frame into long format
df_melted = pd.melt(df)

#view first 10 rows of melted data frame
df_melted.head(10)

	variable value
0	A	 5
1	A	 7
2	A	 7
3	A	 9
4	A	 12
5	A	 12
6	B	 8
7	B	 8
8	B	 9
9	B	 13
Now we can create multiple boxplots using seaborn:
import matplotlib.pyplot as plt
import seaborn as sns

#create seaborn boxplots by group
sns.boxplot(x='variable', y='value', data=df_melted) 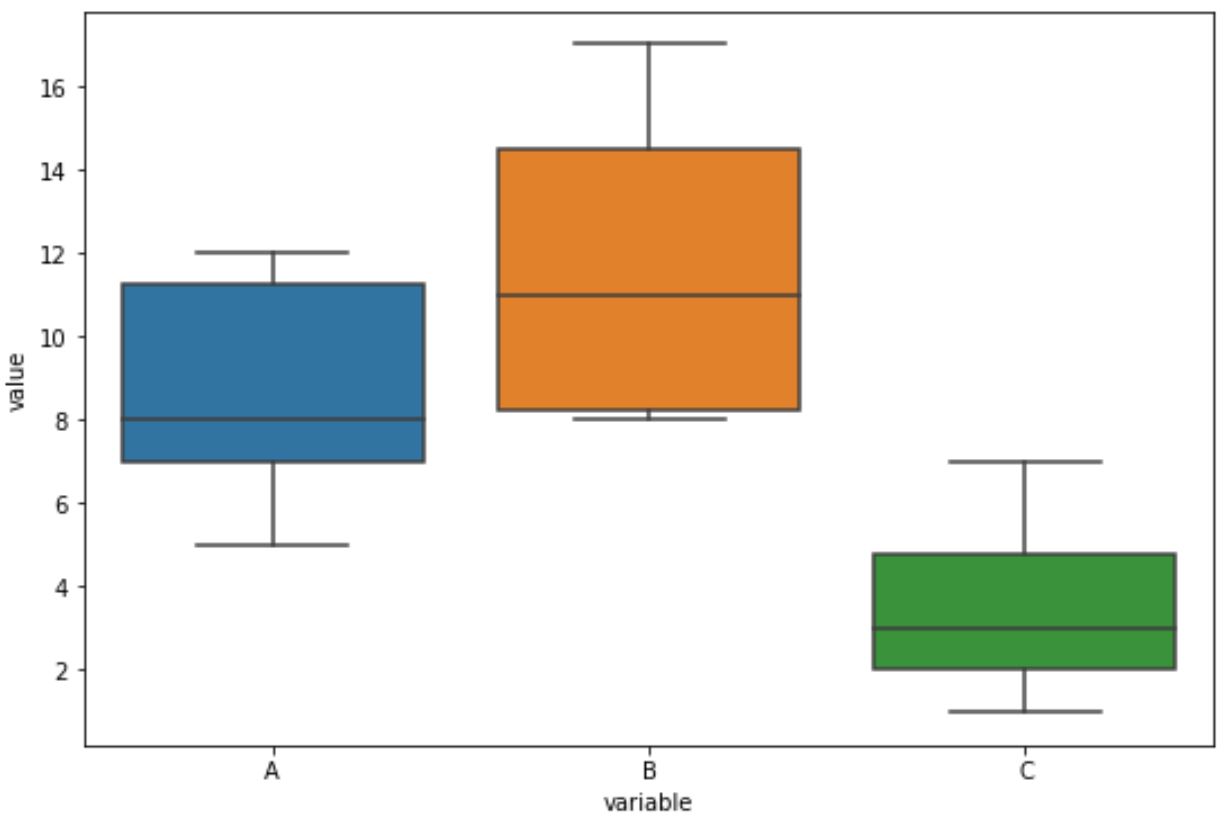
The x-axis displays the teams and the y-axis displays the distribution of points scored.
Note that we can use the following syntax to also add a title and modify the axis labels:
import matplotlib.pyplot as plt
import seaborn as sns

#create seaborn boxplots by group
sns.boxplot(x='variable', y='value', data=df_melted).set(title='Points by Team')

#modify axis labels
plt.xlabel('Team')
plt.ylabel('Points') 
Additional Resources
The following tutorials explain how to create other common visualizations in seaborn:
How to Create a Pie Chart in Seaborn
How to Create an Area Chart in Seaborn
How to Create a Time Series Plot in Seaborn