Output of Paired Sample T-test
In this section, we will discuss the Output of the Paired sample t-test. Output of the Paired sample t-test is given below, which is the output of the previous Calculating Paired sample T-test file:
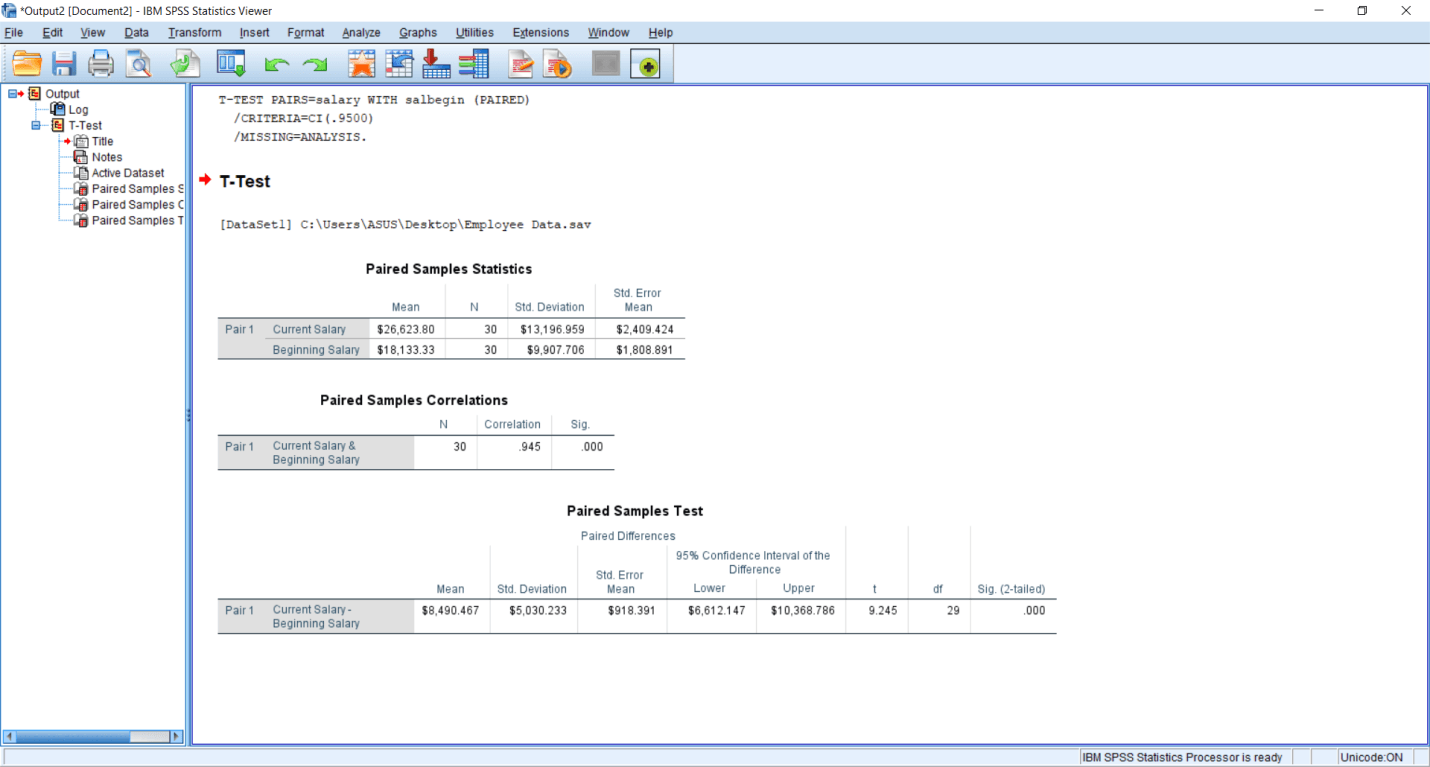
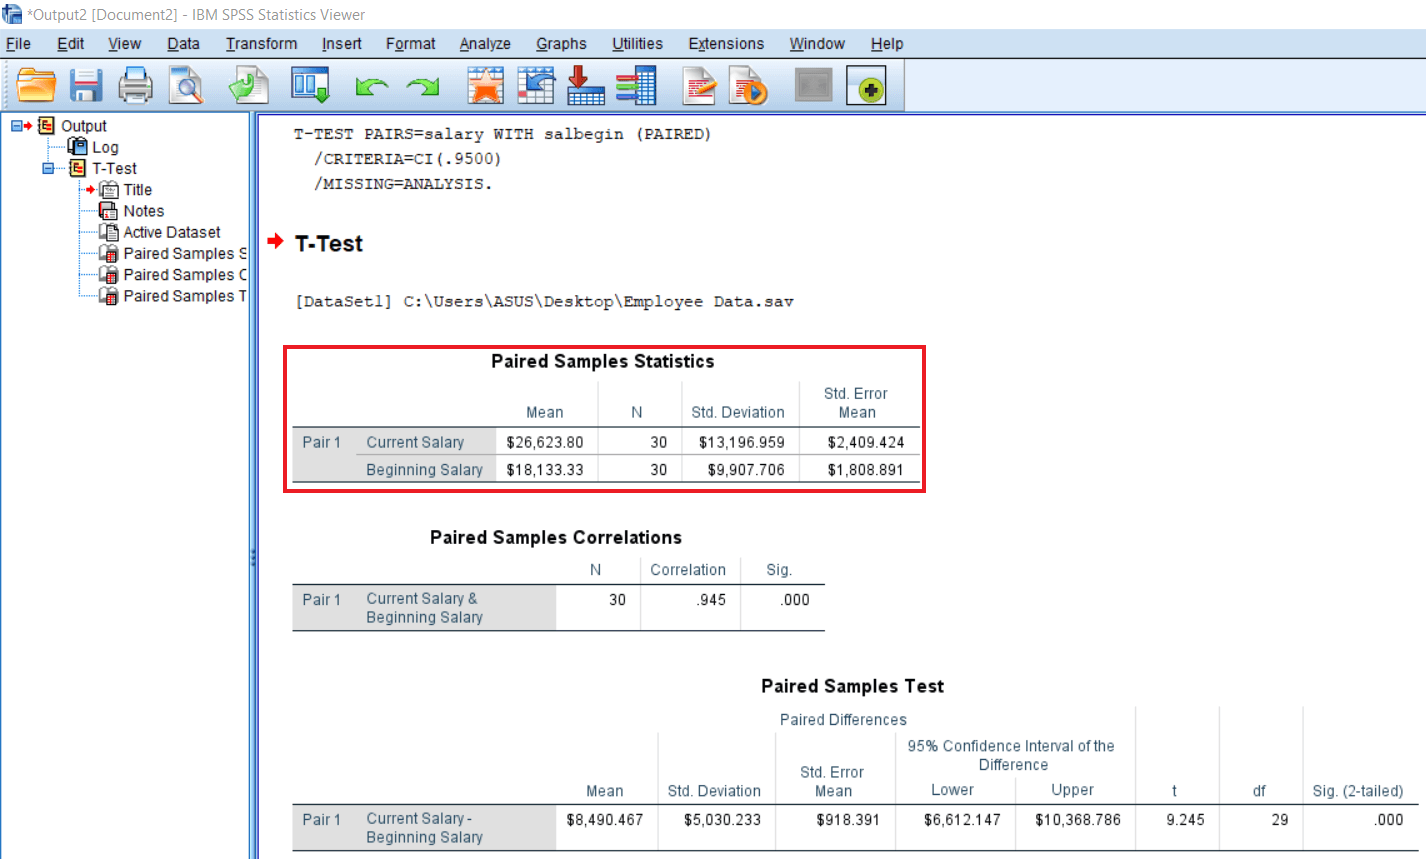
This is the descriptive output. So we can see the average salary. Currently, it is 26 thousand 623.80 dollars while it was 18 thousand 133.33 dollars at the beginning. So the salary has approximately doubled since the employee joined this company. We have 30 in the first group and 30 in the second group because they are the same individuals in two different situations. In Standard Deviation, the current salary is 13 thousand 196.959 dollars, and the beginning salary is 9 thousand 907.706 dollars. The Current salary is much higher as compared to their beginning salary. It means the salary has increased, but there is a huge variation in the salary. The current salary is 2 thousand 409.424 dollars in the Standard error, and the beginning salary is 1 thousand 808.891 dollars, as shown below:
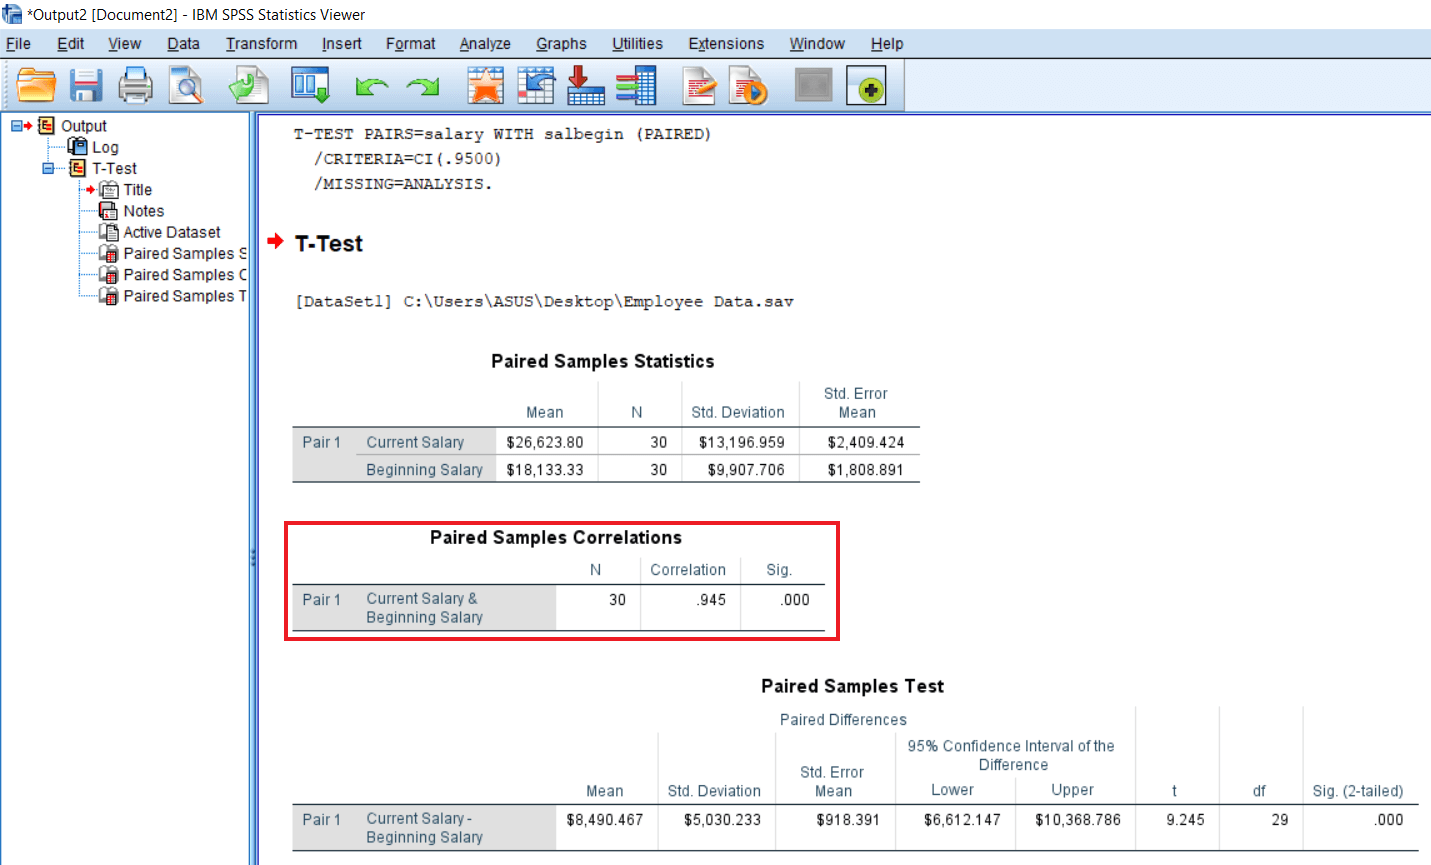
When we calculate the Paired sample T-test, we also get a correlation because since we are taking the subject into different situations. So there is bound to be a significant correlation between them. In this case, the correlation is .945, and that’s a very strong correlation. Significant data is equal to .001 labels. So we are getting a good correlation between the salary scores. So it means those persons who are getting a higher salary earlier also getting a higher salary now. So there is a pattern in the increase or decrease in salary.
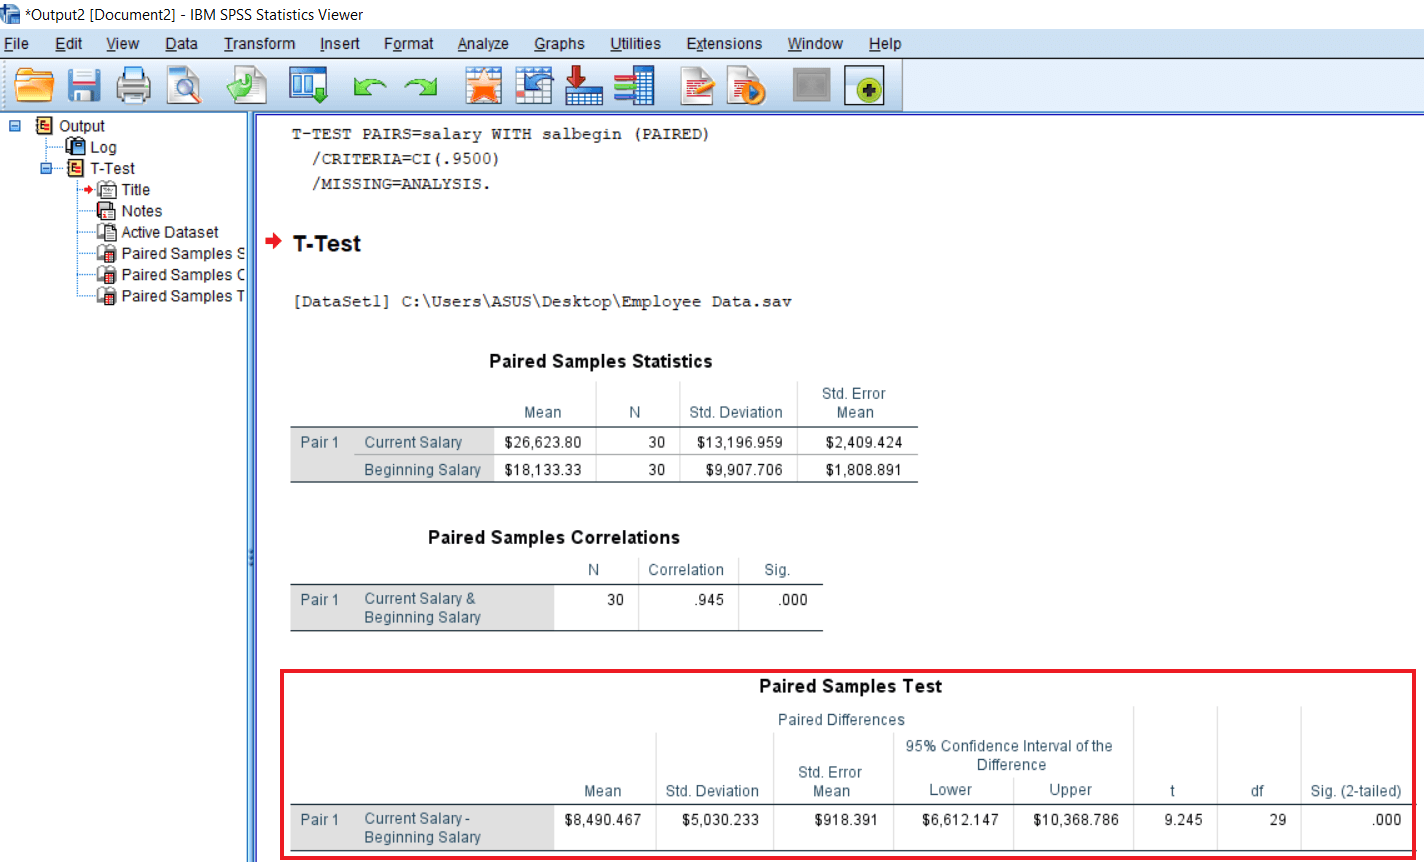
The following table is our final table. So, the average salary for the pair Current Vs. Beginning is 8 thousand 490.467 dollars. This value shows the difference between salaries. Means refers to the main difference between salaries, i.e., 26,623.80-18,133.33. The Standard Deviation is very high, which is 5 thousand 030.233. That is the cause of concern, but it’s much below the average salary, so we can accept that. The Standard error of mean is 918.391. 95% confidential interval is 6 thousand 612 to 10 thousand 368. Both the confidence intervals are positive. So we can consider our outcome reliable. We were not expecting a zero value in this 95% confidence interval. The t value is 9.245, the degree of freedom is 29, and the result is a significant tailed file equal to .001 labels. So it means there has been significant improvement in the salary of employees since they joined the company.