T-Test in R
In statistics, the T-test is one of the most common test which is used to determine whether the mean of the two groups is equal to each other. The assumption for the test is that both groups are sampled from a normal distribution with equal fluctuation. The null hypothesis is that the two means are the same, and the alternative is that they are not identical. It is known that under the null hypothesis, we can compute a t-statistic that will follow a t-distribution with n1 + n2 – 2 degrees of freedom.

In R, there are various types of T-test like one sample and Welch T-test. R provides a t.test() function, which provides a variety of T-tests.
There are the following syntaxes of t.test() function for different T-test
Independent 2-group T-test
here, y is numeric, and x is a binary factor.
Independent 2-group T-test
Here, y1 and y2 are numeric.
Paired T-test
Here, y1 & y2 are numeric.
One sample T-test
Here, Ho: mu=3
How to perform T-tests in R
In the T-test, for specifying equal variances and a pooled variance estimate, we set var.equal=True. We can also use alternative=”less” or alternative=”greater” for specifying one-tailed test.
Let’s see how one-sample, paired sample, and independent samples T-test is performed.
One-Sample T-test
One-Sample T-test is a T-test which compares the mean of a vector against a theoretical mean. There is a following formula which is used to compute the T-test :
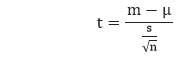
Here,
- M is the mean.
- ? is the theoretical mean.
- s is the standard deviation.
- n is the number of observations.
For evaluating the statistical significance of the t-test, we need to compute the p-value. The p-value range starts from 0 to 1, and is interpreted as follow:
- If the p-value is lower than 0.05, it means we are strongly confident to reject the null hypothesis. So that H3 is accepted.
- If the p-value is higher than 0.05, then it indicates that we don’t have enough evidence to reject the null hypothesis.
We construct the pvalue by looking at the corresponding absolute value of the t-test.
In R, we use the following syntax of t.test() function for performing a one-sample T-test in R.
Here,
- x is the name of our variable of interest.
- ? is described by the null hypothesis, which is set equal to the mean.
Example
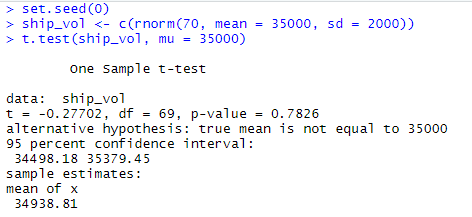
Let’s see an example of One-Sample T-test in which we test whether the volume of a shipment of wood was less than usual(?0=0).
Output:
Paired-Sample T-test
To perform a paired-sample test, we need two vectors data y1 and y2. Then, we will run the code using the syntax t.test (y1, y2, paired = TRUE).
Example:
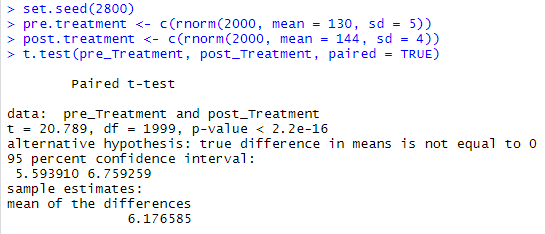
Suppose, we work in a large health clinic, and we are testing a new drug Procardia, which aims to reduce high blood pressure. We find 13000 individuals with high systolic blood pressure (x 150 = 150 mmHg, SD = 10 mmHg), and we provide them with Procardia for a month, and then measure their blood pressure again. We find that the average systolic blood pressure decreased to 144 mmHg with a standard deviation of 9 mmHg.
Output:
Independent-Sample T-test
Depending on the structure of our data and the equality of their variance, the independent-sample T-test can take one of the three forms, which are as follows:
- Independent-Samples T-test where y1 and y2 are numeric.
- Independent-Samples T-test where y1 is numeric and y2 is binary.
- Independent-Samples T-test with equal variances not assumed.
There is the following general form of t.test() function for the independent-sample t-test:
By default, R assumes that the versions of y1 and y2 are unequal, thus defaulting to Welch’s test. For toggling this, we set the flag var.equal=TRUE.
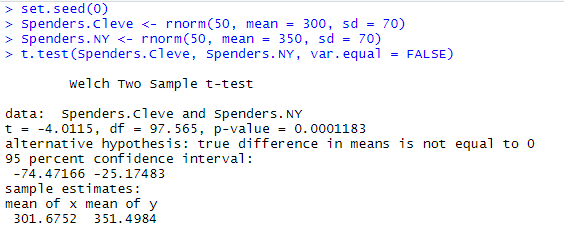
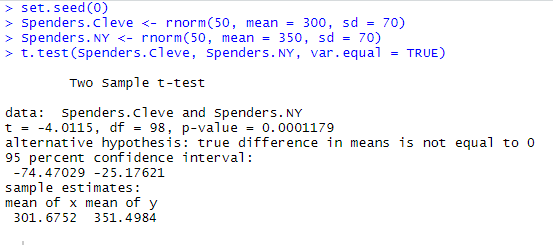
Let’s see some examples in which we test the hypothesis. In this hypothesis, Clevelanders and New Yorkers spend different amounts for eating outside on a monthly basis.
Example 1: Independent-Sample T-test where y1 and y2 are numeric
Output:
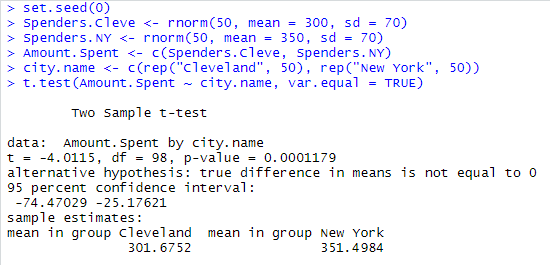
Example 2: Where y1 is numeric and y2 are binary
Output:
Example 3: With equal variance not assumed
Output: