Tableau Area Chart
The area chart represents any quantitative or measures data over different time.
In Tableau, it is a line graph where the area between line and axis is generally filled with color.
For example, consider a data source such as Sample-Superstore, take its dimensions and measures.
The procedure to create the area chart is given below step by step, such as.
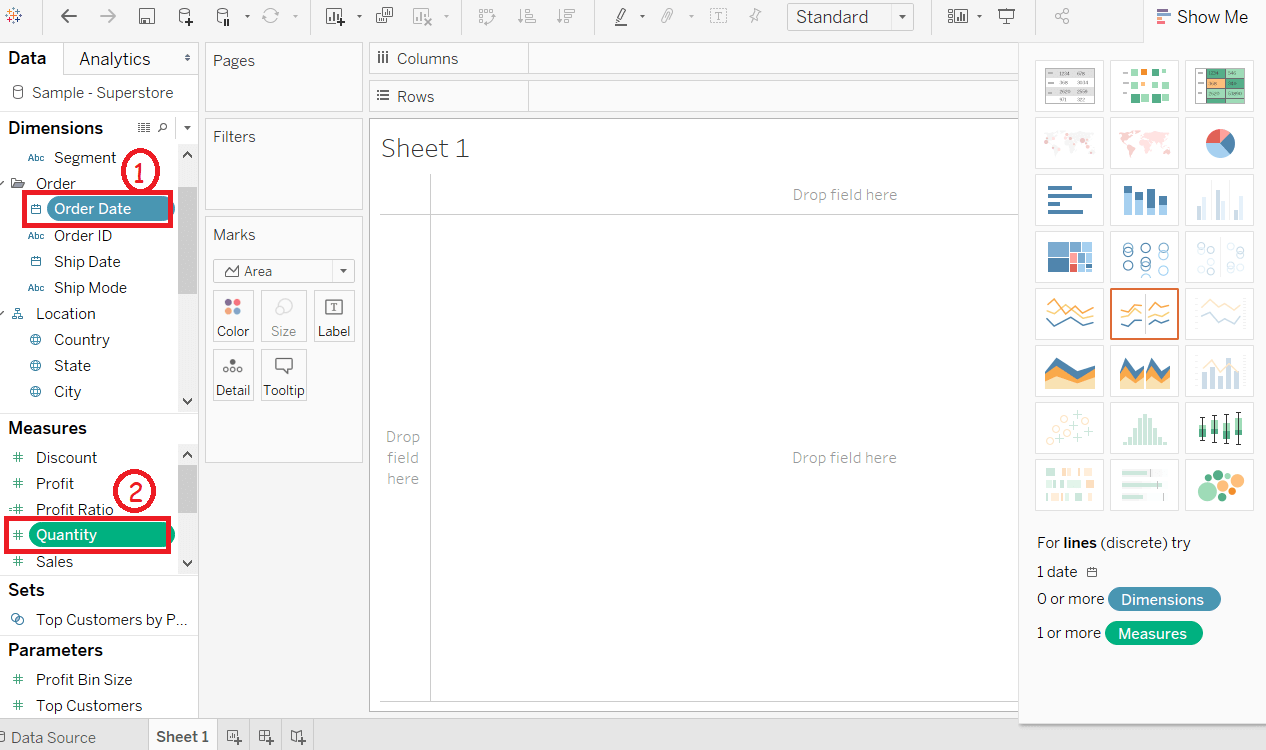
Step 1: Go to the worksheet.
1) Hold the Ctrl key in the keyboard.
2) And select the dimension Order Date and measure Quantity, as shown in the following screenshot.
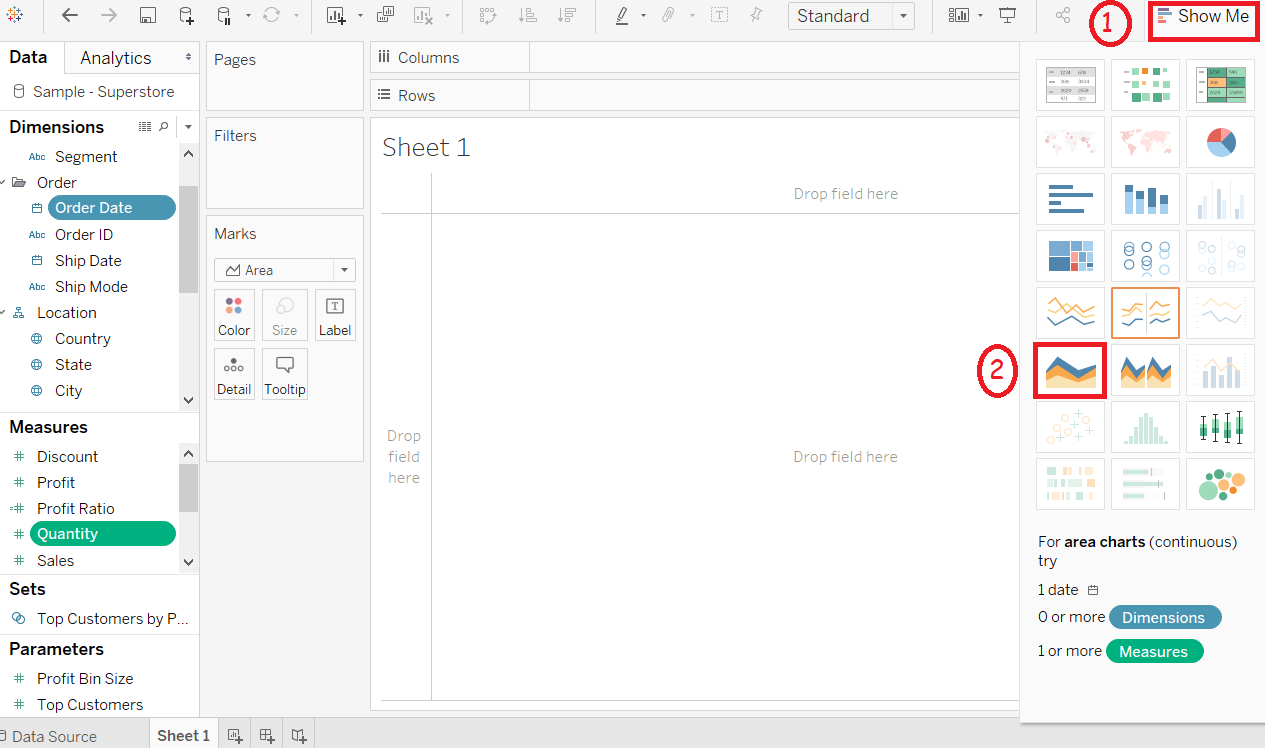
Step 2: Click on the “Show Me” option located at the top right corner of the worksheet.
Step 3: Select the area chart option as shown in the below screenshot.
Step 4: Drag dimension Region and drop into the Color shelf under the Marks pane.
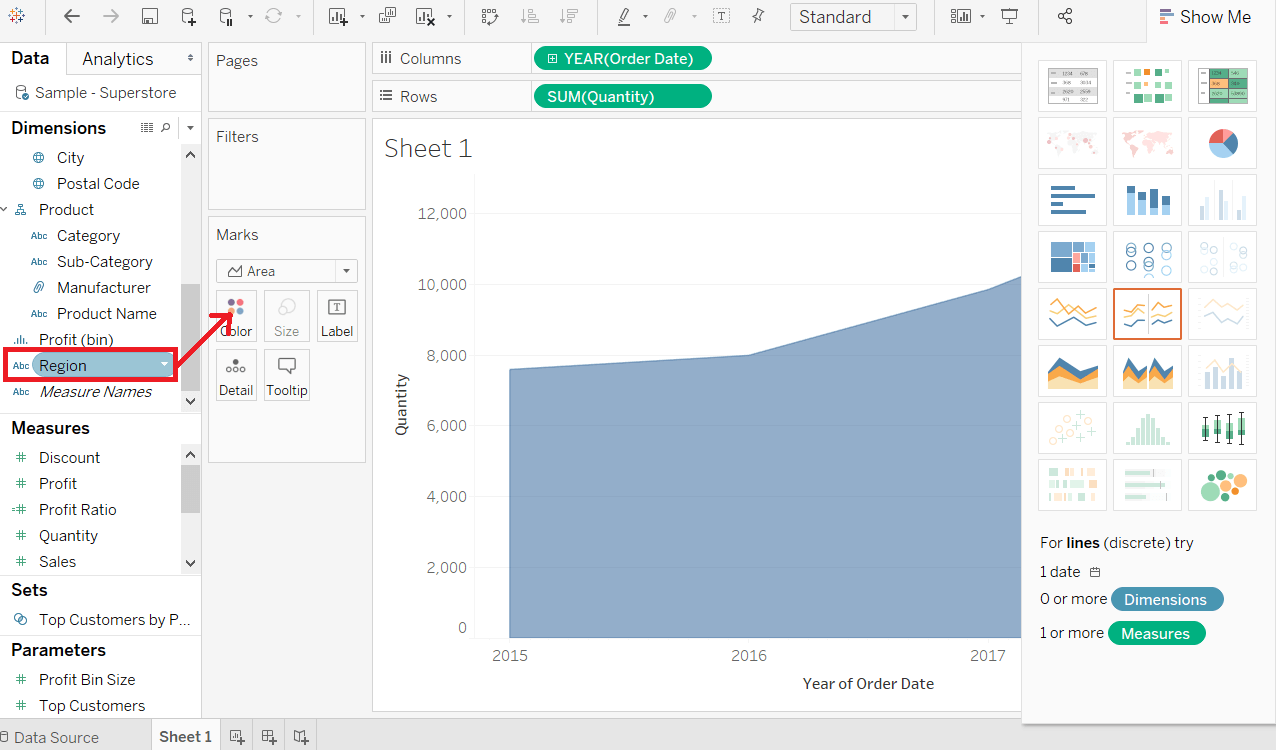
It creates an area chart that shows the Quantity according to the Order Date in a year, as shown in the following screenshot.
