Tableau Dual Axis Chart
The dual axis chart is used to visualize two different measures in two different chart types. A date column and two measures are necessary to build a dual axis chart.
The different scales are used in the graph that helps the user to understand both measures. The procedure to create a dual axis chart is given step by step below.
For example, consider a data source such as Sample-Superstore and its measures and dimensions.
Step 1: Go to the worksheet.
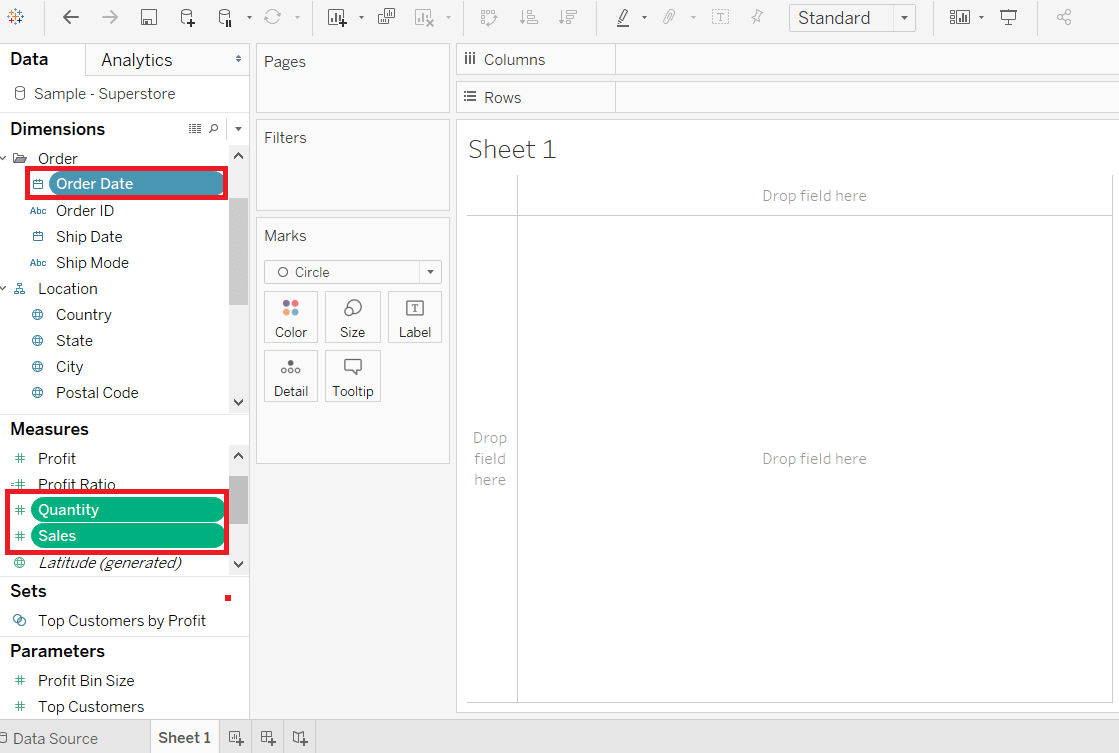
Step 2: Hold the Ctrl key in the keyboard.
Step 3: And select the dimension OrderDate, measures Sales and Quantity as shown in the below screenshot.
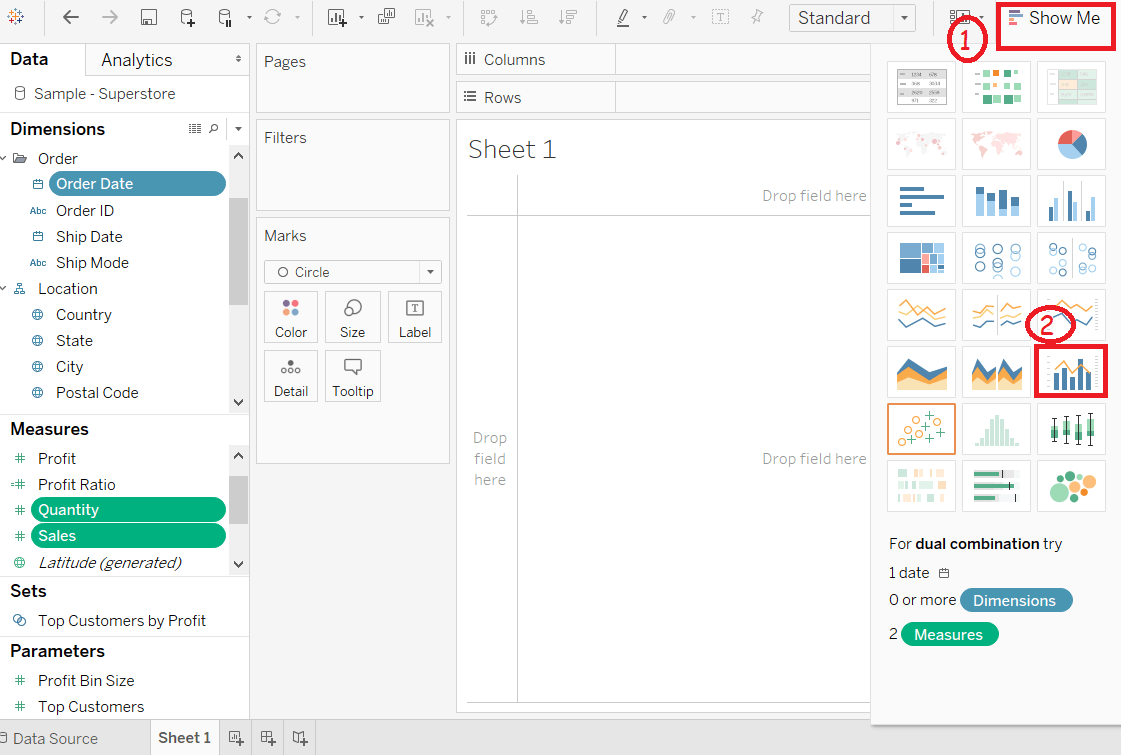
Step 4: Click on “Show Me” option located on the top right corner of the worksheet.
Step 5: Select the “dual combination” icon, as shown in the below screenshot.
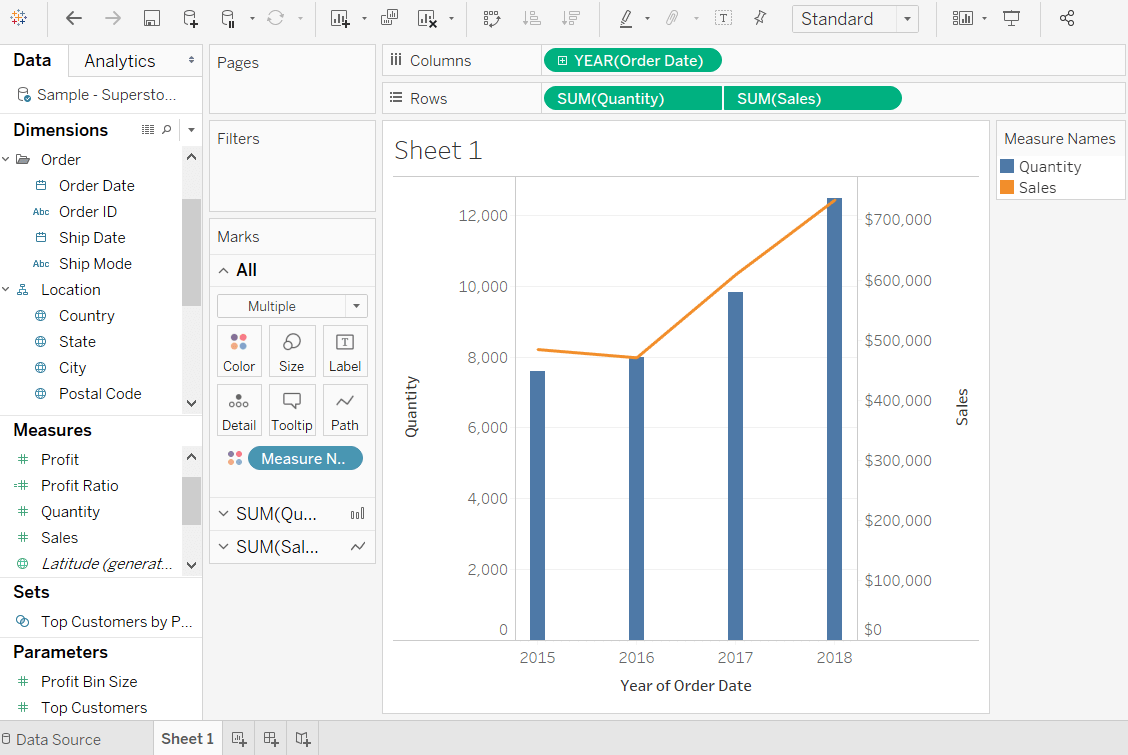
After completion of above all steps, it creates the dual axis chart as shown in the below screenshot.