Tasks and Functionalities of Data Mining
Data mining tasks are designed to be semi-automatic or fully automatic and on large data sets to uncover patterns such as groups or clusters, unusual or over the top data called anomaly detection and dependencies such as association and sequential pattern. Once patterns are uncovered, they can be thought of as a summary of the input data, and further analysis may be carried out using Machine Learning and Predictive analytics. For example, the data mining step might help identify multiple groups in the data that a decision support system can use. Note that data collection, preparation, reporting are not part of data mining.
There is a lot of confusion between data mining and data analysis. Data mining functions are used to define the trends or correlations contained in data mining activities. While data analysis is used to test statistical models that fit the dataset, for example, analysis of a marketing campaign, data mining uses Machine Learning and mathematical and statistical models to discover patterns hidden in the data. In comparison, data mining activities can be divided into two categories:
- Descriptive Data Mining: It includes certain knowledge to understand what is happening within the data without a previous idea. The common data features are highlighted in the data set. For example, count, average etc.
- Predictive Data Mining: It helps developers to provide unlabeled definitions of attributes. With previously available or historical data, data mining can be used to make predictions about critical business metrics based on data’s linearity. For example, predicting the volume of business next quarter based on performance in the previous quarters over several years or judging from the findings of a patient’s medical examinations that is he suffering from any particular disease.
Functionalities of Data Mining
Data mining functionalities are used to represent the type of patterns that have to be discovered in data mining tasks. Data mining tasks can be classified into two types: descriptive and predictive. Descriptive mining tasks define the common features of the data in the database, and the predictive mining tasks act in inference on the current information to develop predictions.
Data mining is extensively used in many areas or sectors. It is used to predict and characterize data. But the ultimate objective in Data Mining Functionalities is to observe the various trends in data mining. There are several data mining functionalities that the organized and scientific methods offer, such as:
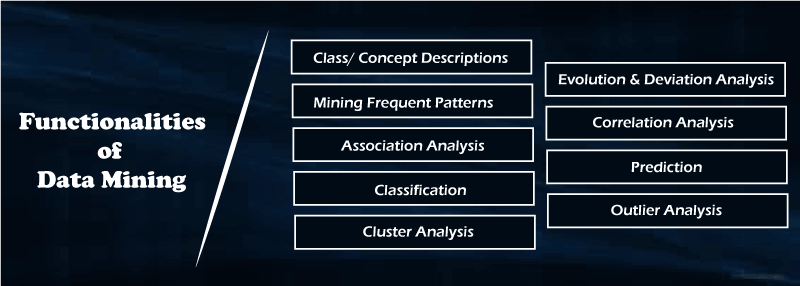
1. Class/Concept Descriptions
A class or concept implies there is a data set or set of features that define the class or a concept. A class can be a category of items on a shop floor, and a concept could be the abstract idea on which data may be categorized like products to be put on clearance sale and non-sale products. There are two concepts here, one that helps with grouping and the other that helps in differentiating.
- Data Characterization: This refers to the summary of general characteristics or features of the class, resulting in specific rules that define a target class. A data analysis technique called Attribute-oriented Induction is employed on the data set for achieving characterization.
- Data Discrimination: Discrimination is used to separate distinct data sets based on the disparity in attribute values. It compares features of a class with features of one or more contrasting classes.g., bar charts, curves and pie charts.
2. Mining Frequent Patterns
One of the functions of data mining is finding data patterns. Frequent patterns are things that are discovered to be most common in data. Various types of frequency can be found in the dataset.
- Frequent item set:This term refers to a group of items that are commonly found together, such as milk and sugar.
- Frequent substructure: It refers to the various types of data structures that can be combined with an item set or subsequences, such as trees and graphs.
- Frequent Subsequence: A regular pattern series, such as buying a phone followed by a cover.
3. Association Analysis
It analyses the set of items that generally occur together in a transactional dataset. It is also known as Market Basket Analysis for its wide use in retail sales. Two parameters are used for determining the association rules:
- It provides which identifies the common item set in the database.
- Confidence is the conditional probability that an item occurs when another item occurs in a transaction.
4. Classification
Classification is a data mining technique that categorizes items in a collection based on some predefined properties. It uses methods like if-then, decision trees or neural networks to predict a class or essentially classify a collection of items. A training set containing items whose properties are known is used to train the system to predict the category of items from an unknown collection of items.
5. Prediction
It defines predict some unavailable data values or spending trends. An object can be anticipated based on the attribute values of the object and attribute values of the classes. It can be a prediction of missing numerical values or increase or decrease trends in time-related information. There are primarily two types of predictions in data mining: numeric and class predictions.
- Numeric predictions are made by creating a linear regression model that is based on historical data. Prediction of numeric values helps businesses ramp up for a future event that might impact the business positively or negatively.
- Class predictions are used to fill in missing class information for products using a training data set where the class for products is known.
6. Cluster Analysis
In image processing, pattern recognition and bioinformatics, clustering is a popular data mining functionality. It is similar to classification, but the classes are not predefined. Data attributes represent the classes. Similar data are grouped together, with the difference being that a class label is not known. Clustering algorithms group data based on similar features and dissimilarities.
7. Outlier Analysis
Outlier analysis is important to understand the quality of data. If there are too many outliers, you cannot trust the data or draw patterns. An outlier analysis determines if there is something out of turn in the data and whether it indicates a situation that a business needs to consider and take measures to mitigate. An outlier analysis of the data that cannot be grouped into any classes by the algorithms is pulled up.
8. Evolution and Deviation Analysis
Evolution Analysis pertains to the study of data sets that change over time. Evolution analysis models are designed to capture evolutionary trends in data helping to characterize, classify, cluster or discriminate time-related data.
9. Correlation Analysis
Correlation is a mathematical technique for determining whether and how strongly two attributes is related to one another. It refers to the various types of data structures, such as trees and graphs, that can be combined with an item set or subsequence. It determines how well two numerically measured continuous variables are linked. Researchers can use this type of analysis to see if there are any possible correlations between variables in their study.