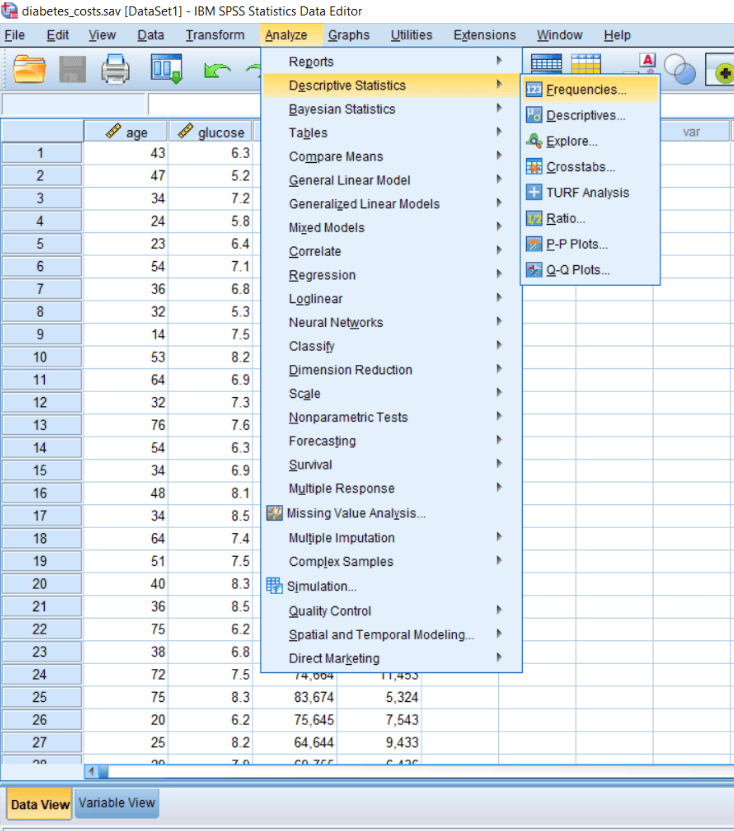
Types of Descriptive Statistics
In this section, we will learn about the types of Descriptive Statistics. For this, we will go to the Analyze menu and then Descriptive statistics. Now we can see all the Descriptive statistics in the following image, and we can choose them according to our purpose.
We can see that the first option is Frequencies, which is the most basic type of Descriptive stats. They simply tell the number of times a particular observation occurs in data. For example, we might be interested in knowing how many individuals in this data set are 25 years age, how many individuals are 46 years age or there is any repetition. There might be two-three or more people who are 25 years or 46 years. So for that, we may wish to calculate the frequencies. If we want to do that, click on Frequencies. Now we can see a dialog box like this:
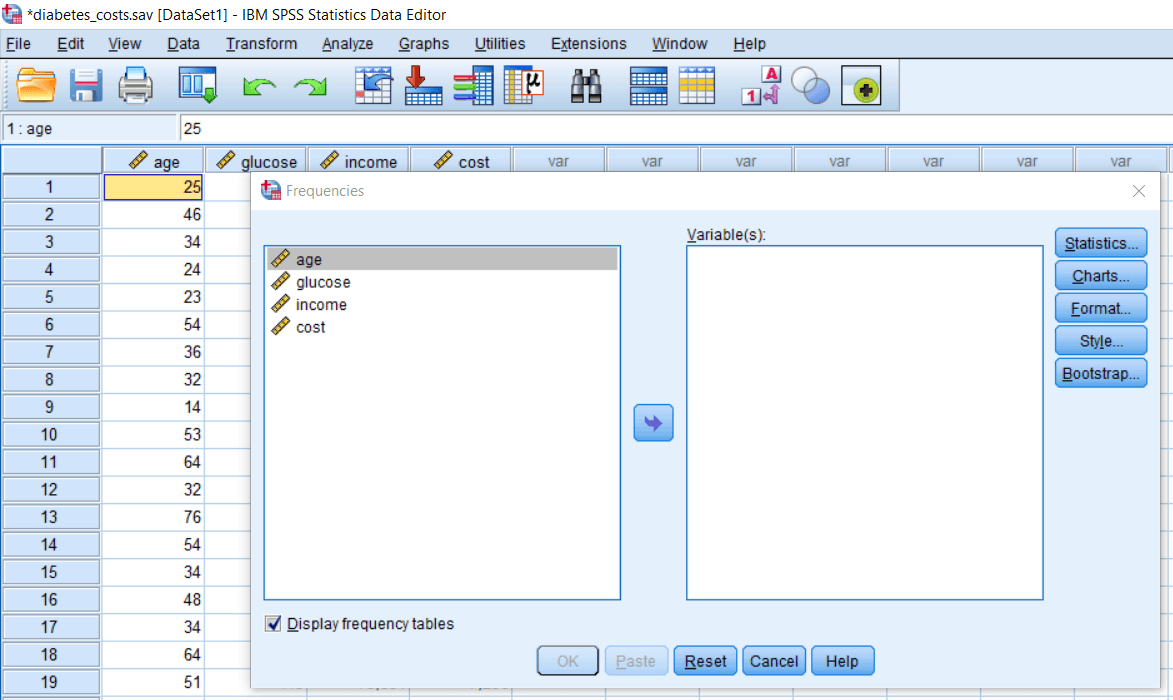
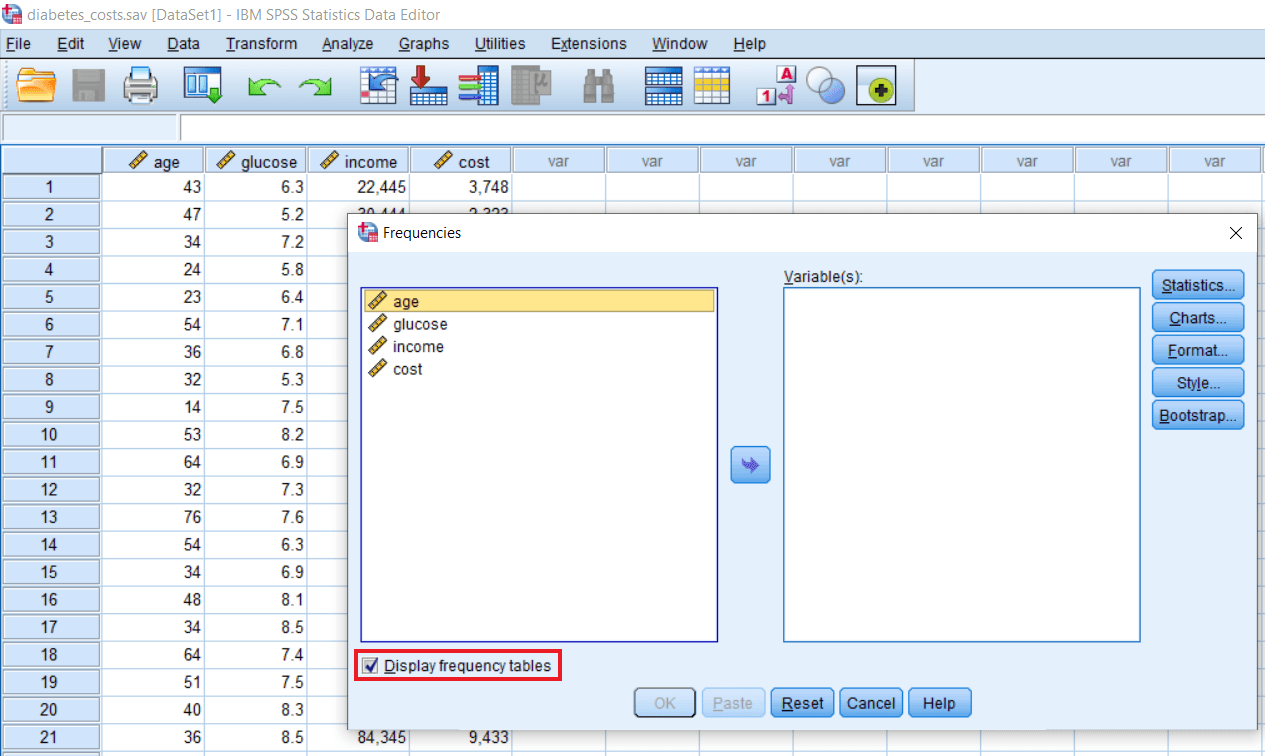
In the above dialog box, we can see an automatically checked box and that read as a Display frequency table. If we click on this, we are going to see the frequency tables.
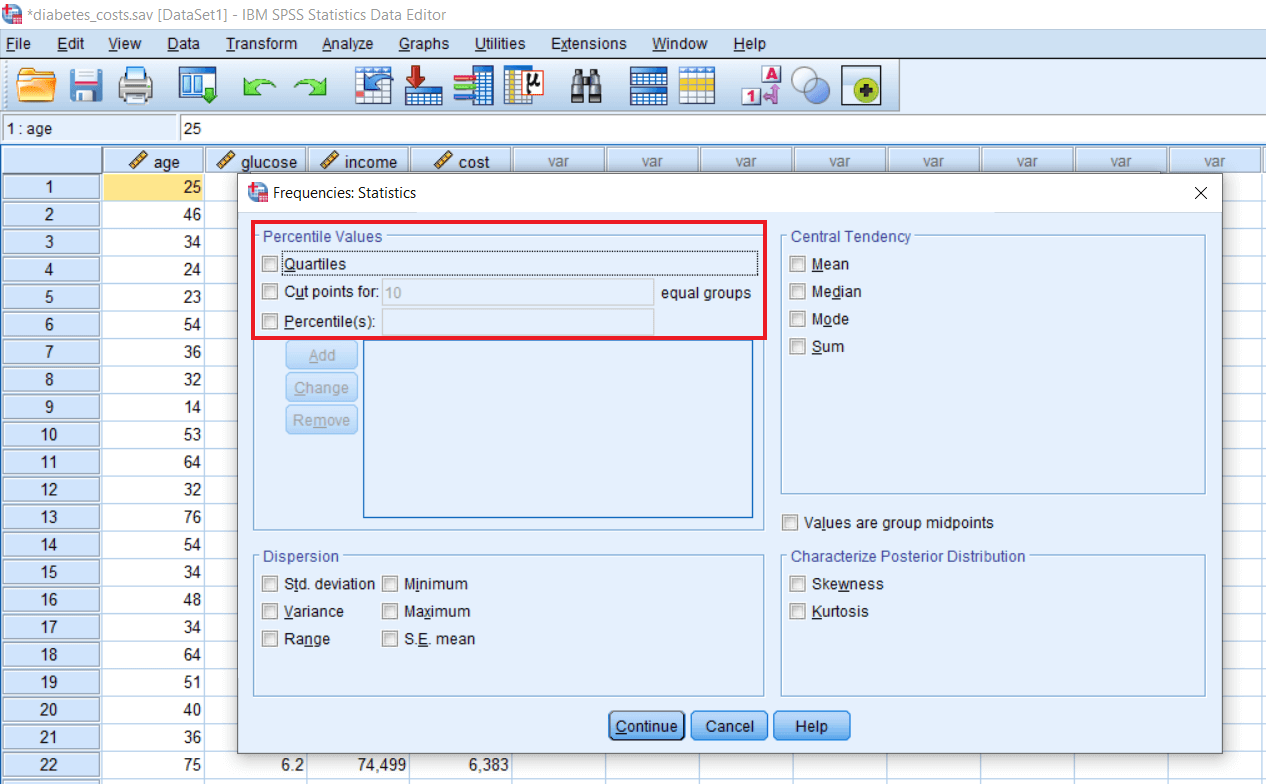
Apart from this, we have options like Statistics. When we click on this, we will see a dialog box like this:
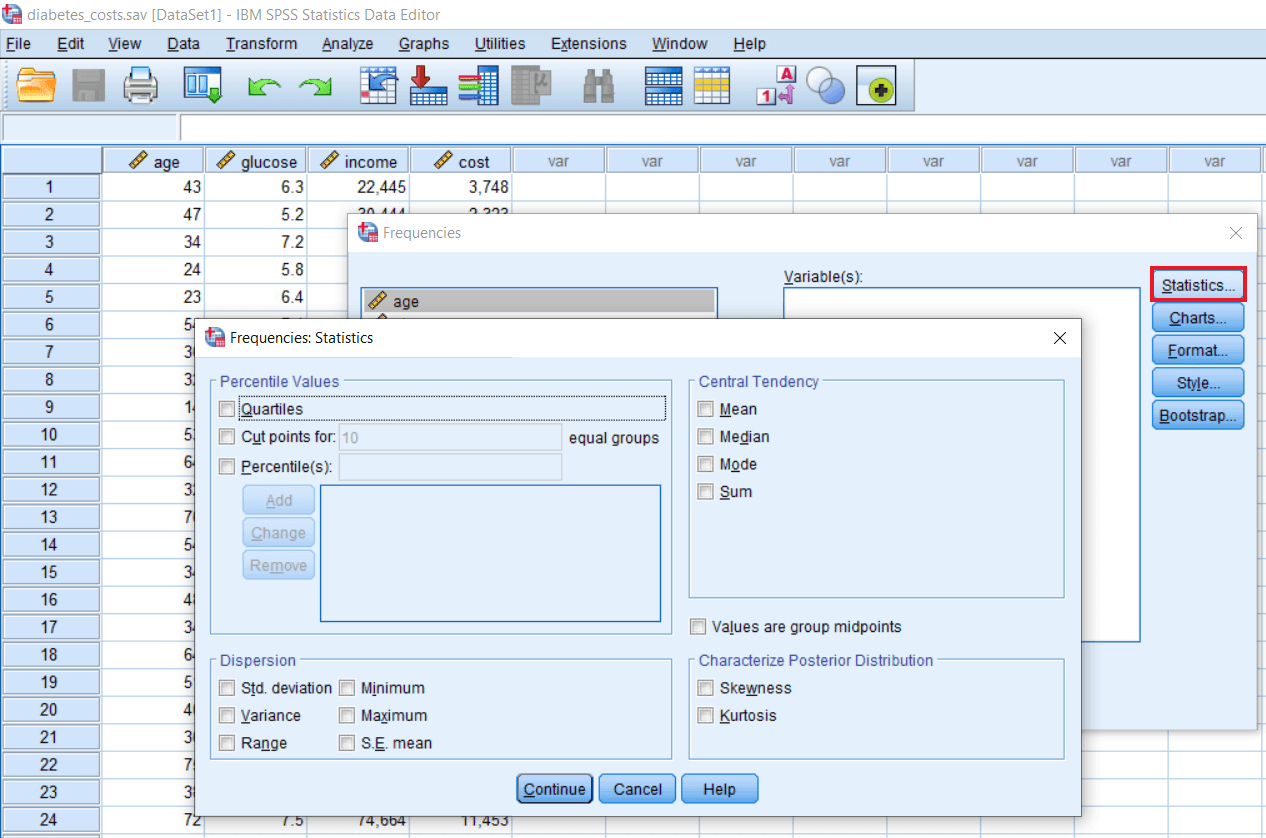
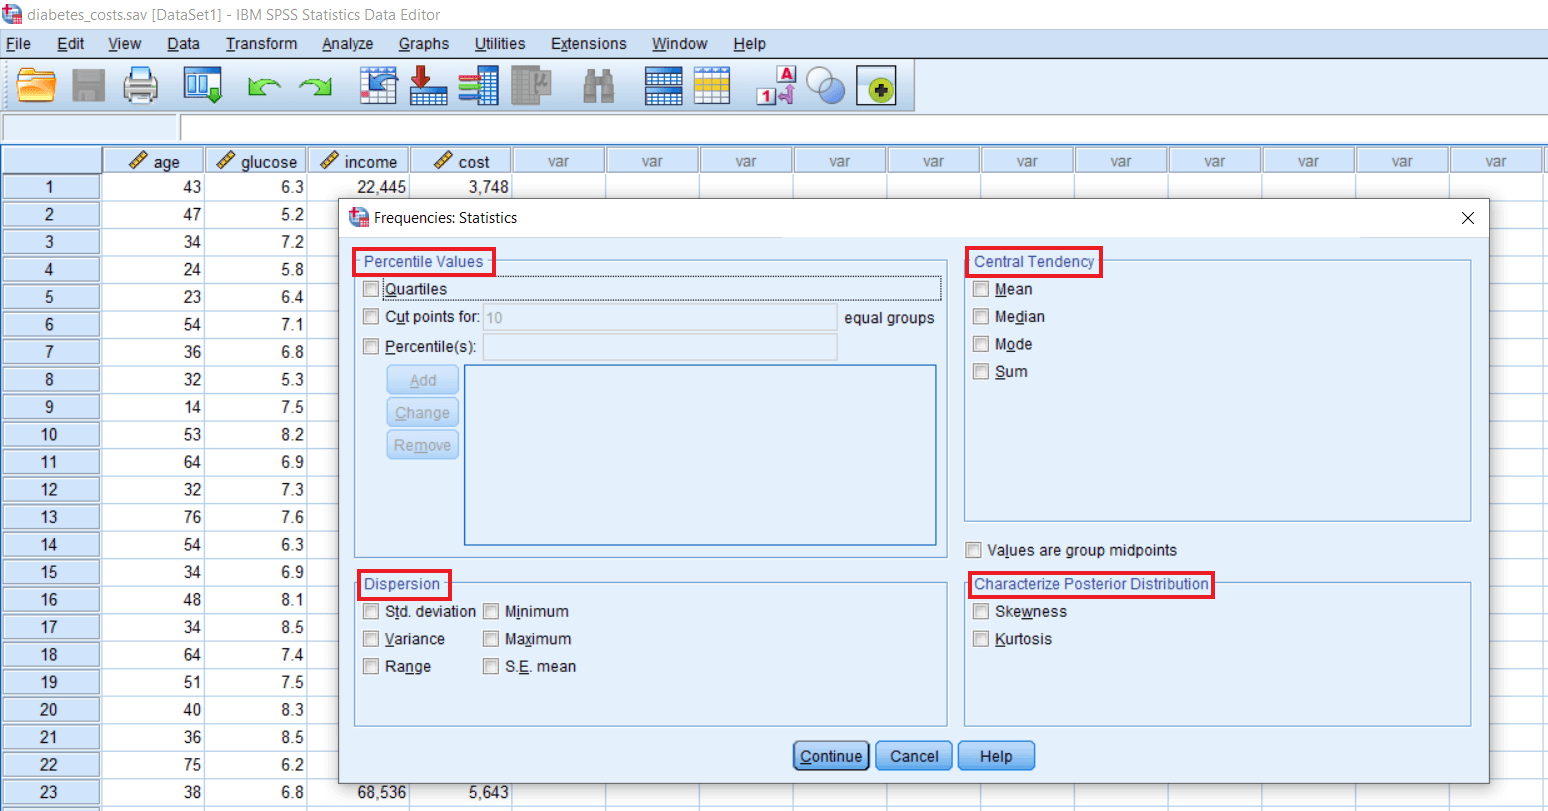
If we have no background in stats and just want to know what shots of descriptive stats are there, we can take the help of SPSS to teach ourselves the types of descriptive stats. In the above image, we can see how SPSS has categorized various types of descriptive stats for us. We have measures of Central Tendency. If we look at the dialog box, we can see there are four types of descriptive stats. The first one is a measure of Central tendency. The second one is a measure of Dispersion. The third one is a measure of Distribution. The fourth one is a measure of Percentile scores.
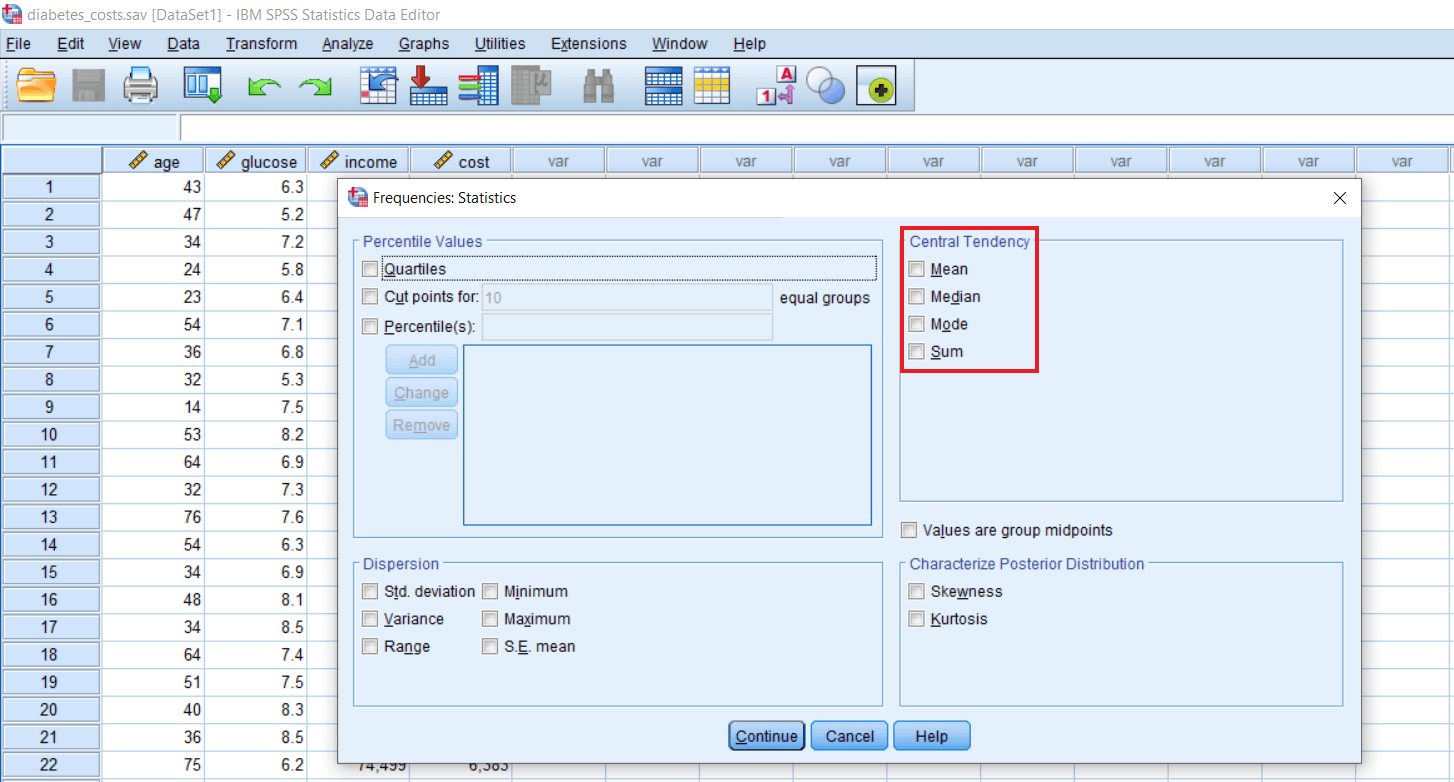
Central tendency shows us where our data is concentrated or where most of the observations lie. Central tendency contains Mean, Median, Mode, and Sum of all the scores.
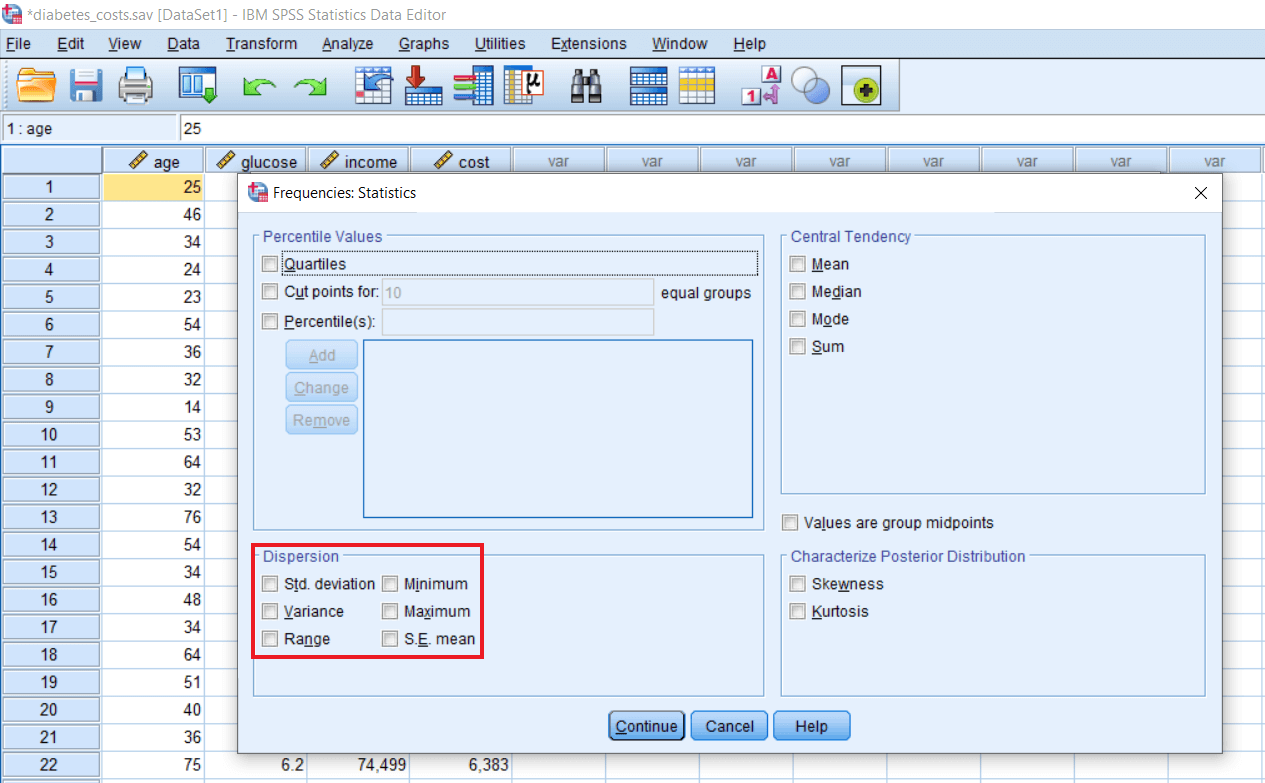
Dispersion contains Std. Deviation, Minimum, Maximum, Variance, Range, S.E. Mean (standard error of the mean). If we are interested in communicating the spread of score or what extent scores are spread away from the mean or the central score, we can use the measure of standard deviation. For example, if we are in our office, we want to communicate that the salary of person A is highly distinct as compared to the salary of all other persons working in this office. If we say distinct, it might be very less or very high. It could be both the situation. So for that, we can look at the measure of dispersion. So, what is the standard deviation of salary scores in that particular office. So if the standard deviation is high, it means many individuals are earning very high in this office, and many individuals are earning very less. That’s why we are having a huge spread of scores. There are highs and lows, so minimum and maximum would be huge. There will be a huge difference between the minimum and maximum scores. So that is going to spread our entire score in a wide range. So Range would again be high. Range basically tells us to what extent scores are dispersed or spread from each other.
Distribution contains Skewness and Kurtosis. If we want to communicate the shape of our distribution, we can use measures of Distribution. The shape of Distribution means how the age variable, glucose variable, or any variable that we are studying are distributed. If we plot them how they look and how we can visualize them, in that case, we have measures of Distribution. To measure, we have Skewness and Kurtosis.
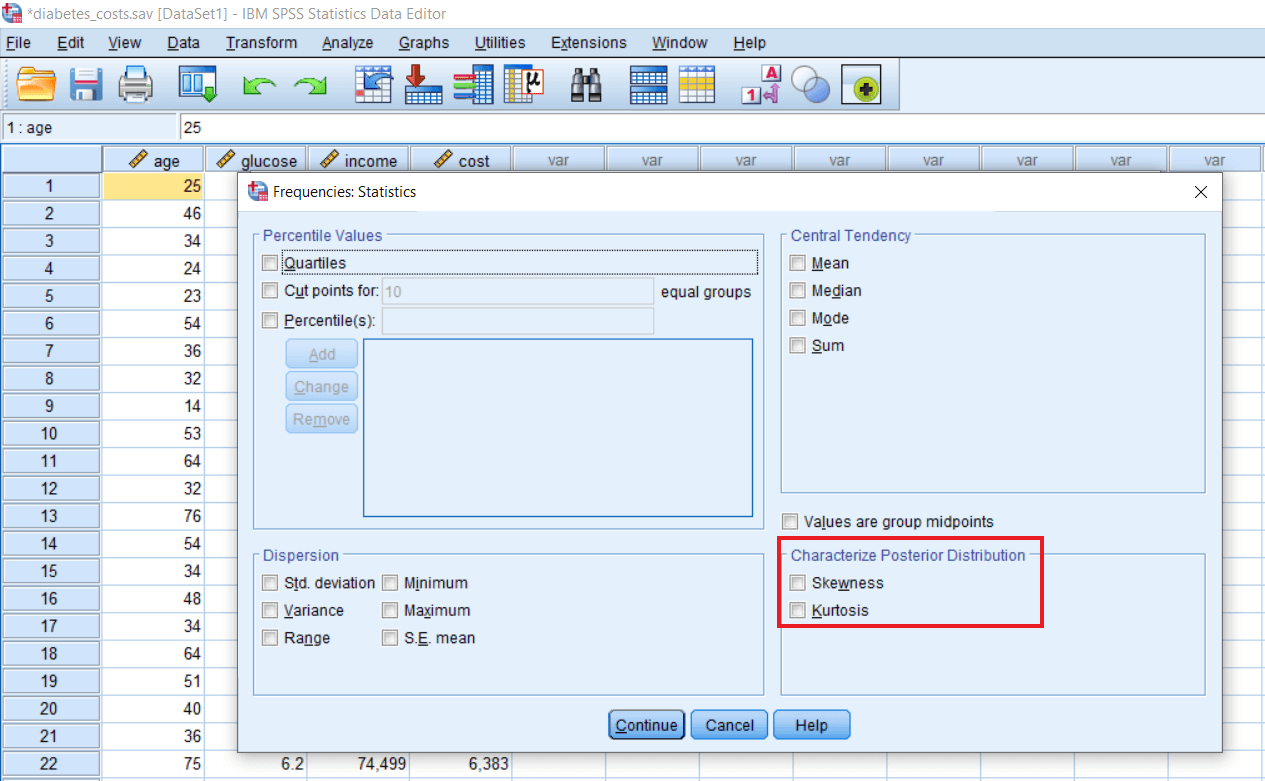
Percentile score is one of the most fascinating commonly used measures of Descriptive stats. Percentiles are nothing but a type of score that tells us what percentage of people in a given set of observations lie below a particular score. For example, if in this office, around 90% of workers earn less than 10000 dollars, so 90th percentile is 10000 in this case. Percentile can be very instructive and can be used in many competitive examinations like CAT (common admission test for MBA). In that case, we don’t get the percentages or averages. We will get the percentile score. It basically tells us the percentage of the candidates scoring below a particular candidate or particular score. To find the percentage, we will take the help of percentiles and quartiles. Quartiles are nothing but a type of percentiles. If we divide all the percentiles that can vary from 0 to 100 into 4 categories, 4 groups or 4 quarters, we call them quartiles.