Wireshark Tutorial

What is Wireshark?
Wireshark is an open-source packet analyzer, which is used for education, analysis, software development, communication protocol development, and network troubleshooting.
It is used to track the packets so that each one is filtered to meet our specific needs. It is commonly called as a sniffer, network protocol analyzer, and network analyzer. It is also used by network security engineers to examine security problems.
Wireshark is a free to use application which is used to apprehend the data back and forth. It is often called as a free packet sniffer computer application. It puts the network card into an unselective mode, i.e., to accept all the packets which it receives.
Uses of Wireshark:
Wireshark can be used in the following ways:
- It is used by network security engineers to examine security problems.
- It allows the users to watch all the traffic being passed over the network.
- It is used by network engineers to troubleshoot network issues.
- It also helps to troubleshoot latency issues and malicious activities on your network.
- It can also analyze dropped packets.
- It helps us to know how all the devices like laptop, mobile phones, desktop, switch, routers, etc., communicate in a local network or the rest of the world.
What is a packet?
A packet is a unit of data which is transmitted over a network between the origin and the destination. Network packets are small, i.e., maximum 1.5 Kilobytes for Ethernet packets and 64 Kilobytes for IP packets. The data packets in the Wireshark can be viewed online and can be analyzed offline.
History of Wireshark:
In the late 1990’s Gerald Combs, a computer science graduate of the University of Missouri-Kansas City was working for the small ISP (Internet Service Provider). The protocol at that time did not complete the primary requirements. So, he started writing ethereal and released the first version around 1998. The Network integration services owned the Ethernet trademark.
Combos still held the copyright on most of the ethereal source code, and the rest of the source code was re-distributed under the GNU GPL. He did not own the Ethereal trademark, so he changed the name to Wireshark. He used the contents of the ethereal as the basis.
Wireshark has won several industry rewards over the years including eWeek, InfoWorld, PC Magazine and also as a top-rated packet sniffer. Combos continued the work and released the new version of the software. There are around 600 contributed authors for the Wireshark product website.
Functionality of Wireshark:
Wireshark is similar to tcpdump in networking. Tcpdump is a common packet analyzer which allows the user to display other packets and TCP/IP packets, being transmitted and received over a network attached to the computer. It has a graphic end and some sorting and filtering functions. Wireshark users can see all the traffic passing through the network.
Wireshark can also monitor the unicast traffic which is not sent to the network’s MAC address interface. But, the switch does not pass all the traffic to the port. Hence, the promiscuous mode is not sufficient to see all the traffic. The various network taps or port mirroring is used to extend capture at any point.
Port mirroring is a method to monitor network traffic. When it is enabled, the switch sends the copies of all the network packets present at one port to another port.
What is color coding in Wireshark?
The packets in the Wireshark are highlighted with blue, black, and green color. These colors help users to identify the types of traffic. It is also called as packet colorization. The kinds of coloring rules in the Wireshark are temporary rules and permanent rules.
- The temporary rules are there until the program is in active mode or until we quit the program.
- The permanent color rules are available until the Wireshark is in use or the next time you run the Wireshark. The steps to apply color filters will be discussed later in this topic.
Features of Wireshark
- It is multi-platform software, i.e., it can run on Linux, Windows, OS X, FreeBSD, NetBSD, etc.
- It is a standard three-pane packet browser.
- It performs deep inspection of the hundreds of protocols.
- It often involves live analysis, i.e., from the different types of the network like the Ethernet, loopback, etc., we can read live data.
- It has sort and filter options which makes ease to the user to view the data.
- It is also useful in VoIP analysis.
- It can also capture raw USB traffic.
- Various settings, like timers and filters, can be used to filter the output.
- It can only capture packet on the PCAP (an application programming interface used to capture the network) supported networks.
- Wireshark supports a variety of well-documented capture file formats such as the PcapNg and Libpcap. These formats are used for storing the captured data.
- It is the no.1 piece of software for its purpose. It has countless applications ranging from the tracing down, unauthorized traffic, firewall settings, etc.
Installation of Wireshark Software
Below are the steps to install the Wireshark software on the computer:
- Open the web browser.
- Search for ‘Download Wireshark.’
- Select the Windows installer according to your system configuration, either 32-bt or 64-bit. Save the program and close the browser.
- Now, open the software, and follow the install instruction by accepting the license.
- The Wireshark is ready for use.
On the network and Internet settings option, we can check the interface connected to our computer.
If you are Linux users, then you will find Wireshark in its package repositories.
By selecting the current interface, we can get the traffic traversing through that interface. The version used here is 3.0.3. This version will open as:
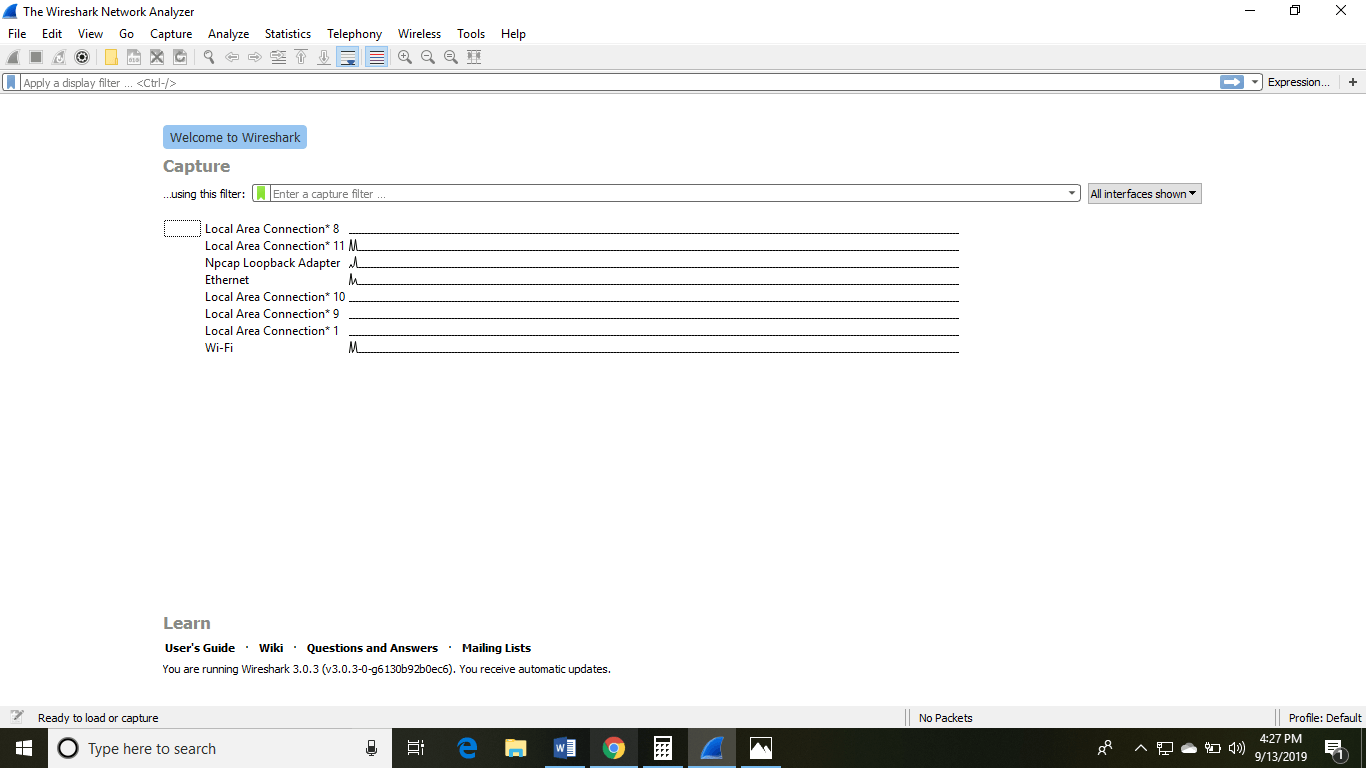
The Wireshark software window is shown above, and all the processes on the network are carried within this screen only.
The options given on the list are the Interface list options. The number of interface options will be present. Selection of any option will determine all the traffic. For example, from the above fig. select the Wi-Fi option. After this, a new window opens up, which will show all the current traffic on the network. Below is the image which tells us about the live capture of packets and our Wireshark will look like:
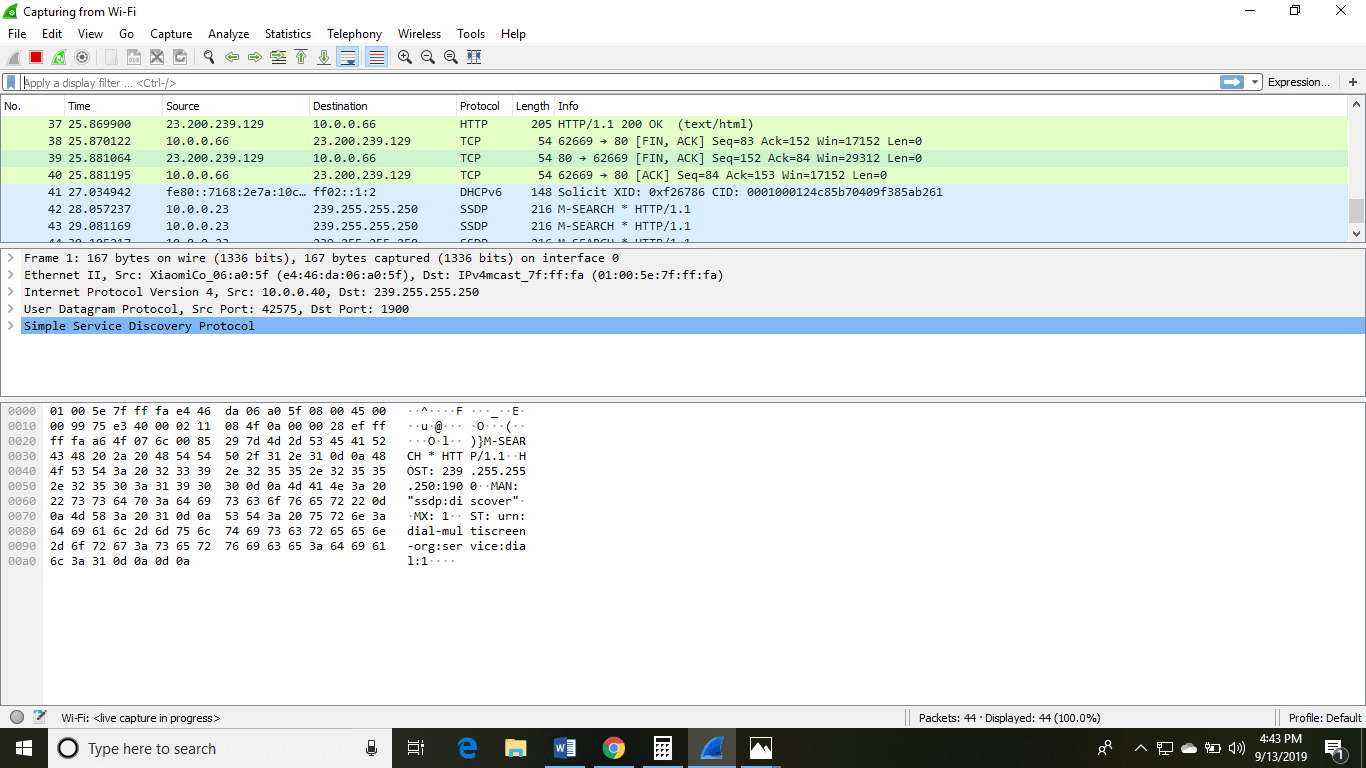
The above arrow shows the packet content written in hexadecimal or the ASCII format. And the information above the packet content, are the details of the packet header.
It will continue listening to all the data packets, and you will get much data. If you want to see a particular data, then you can click on the red button. The traffic will be stationary, and you can note the parameters like time, source, destination, the protocol being used, length, and the Info. To view in-depth detail, you can click on that particular address; a lot of the information will be displayed below that.
There will be detailed information on HTTP packets, TCP packets, etc. The red button is shown below:
The screen/interface of the Wireshark is divided into five parts:
- First part contains a menu bar and the options displayed below it. This part is at the top of the window. File and the capture menus options are commonly used in Wireshark. The capture menu allows to start the capturing process. And the File menu is used to open and save a capture file.
- The second part is the packet listing window. It determines the packet flow or the captured packets in the traffic. It includes the packet number, time, source, destination, protocol, length, and info. We can sort the packet list by clicking on the column name.
- Next comes the packet header- detailed window. It contains detailed information about the components of the packets. The protocol info can also be expanded or minimized according to the information required.
- The bottom window called the packet contents window, which displays the content in ASCII and hexadecimal format.
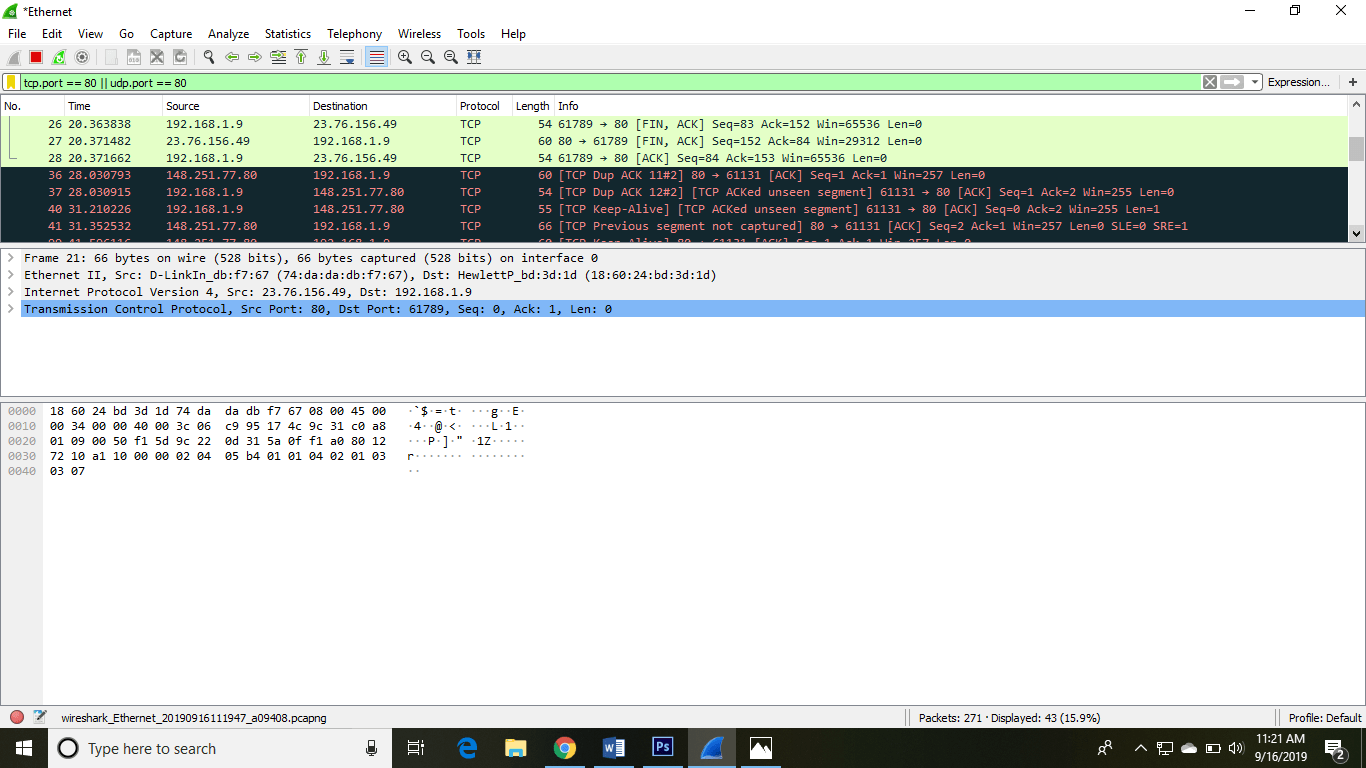
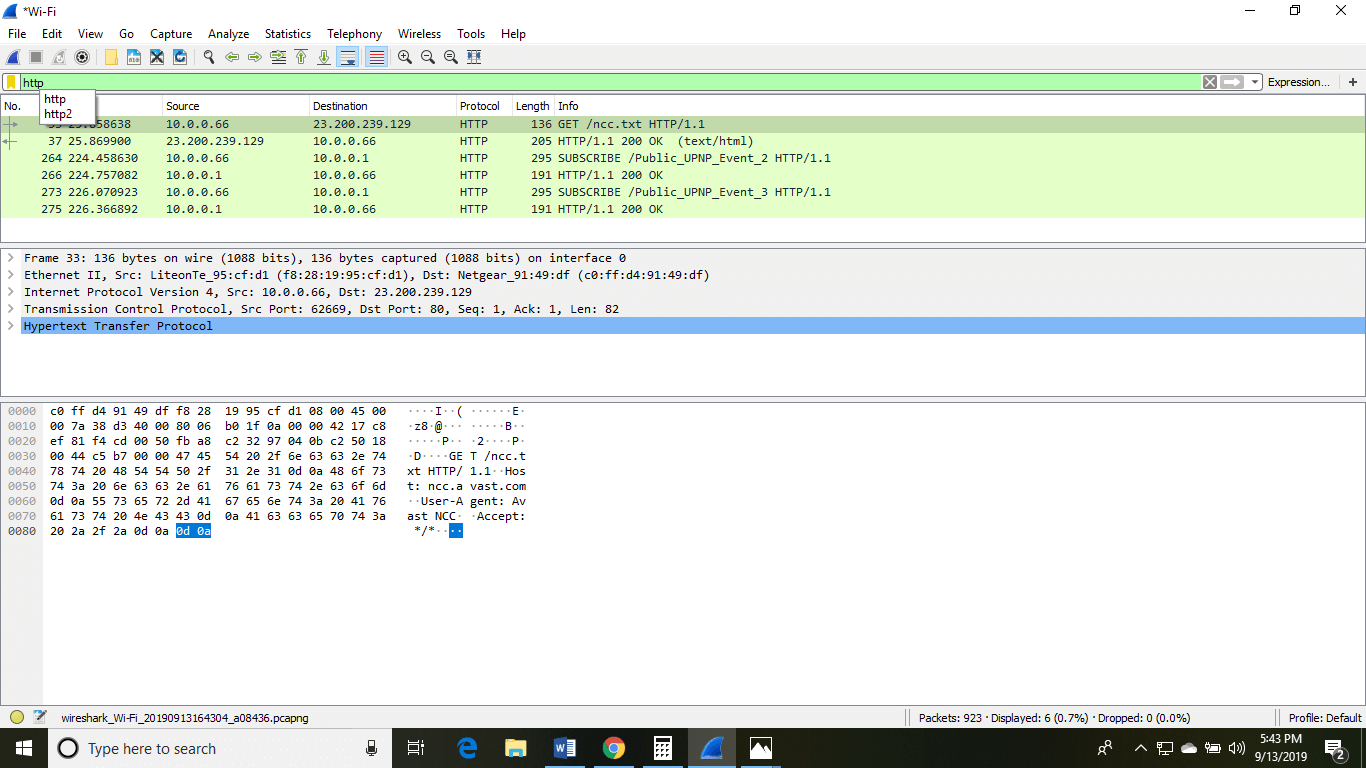
- At last, is the filter field which is at the top of the display. The captured packets on the screen can be filtered based on any component according to your requirements. For example, if we want to see only the packets with the HTTP protocol, we can apply filters to that option. All the packets with HTTP as the protocol will only be displayed on the screen, shown below:
You can also select the connection to which your computer is connected. For example, in this PC, we have chosen the current network, i.e., the ETHERNET.
After connecting, you can watch the traffic below:
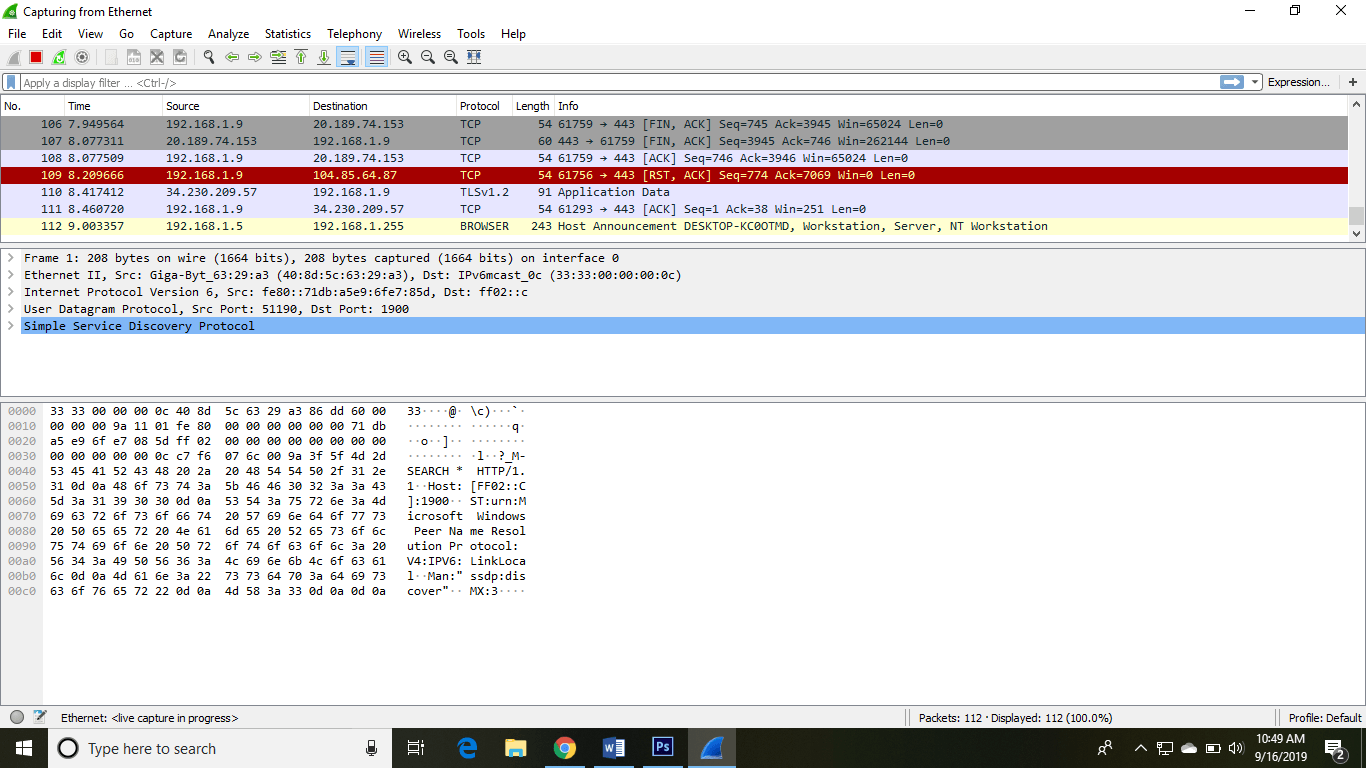
In view option on the menu bar, we can also change the view of the interface. You can change the number of things in the view menu. You can also enable or disable any option according to the requirements.
There is a filter block below the menu bar, from where a large amount of data can be filtered. For example, if we apply a filter for HTTP, only the interfaces with the HTTP will be listed.
If you want to filter according to the source, right-click on the source you want to filter and select ‘Apply as Filter’ and choose ‘…and filter.’
Steps for the permanent colorization are: click on the ‘View’ option on the menu bar and select ‘Coloring Rules.’ The table will appear like the image shown below:
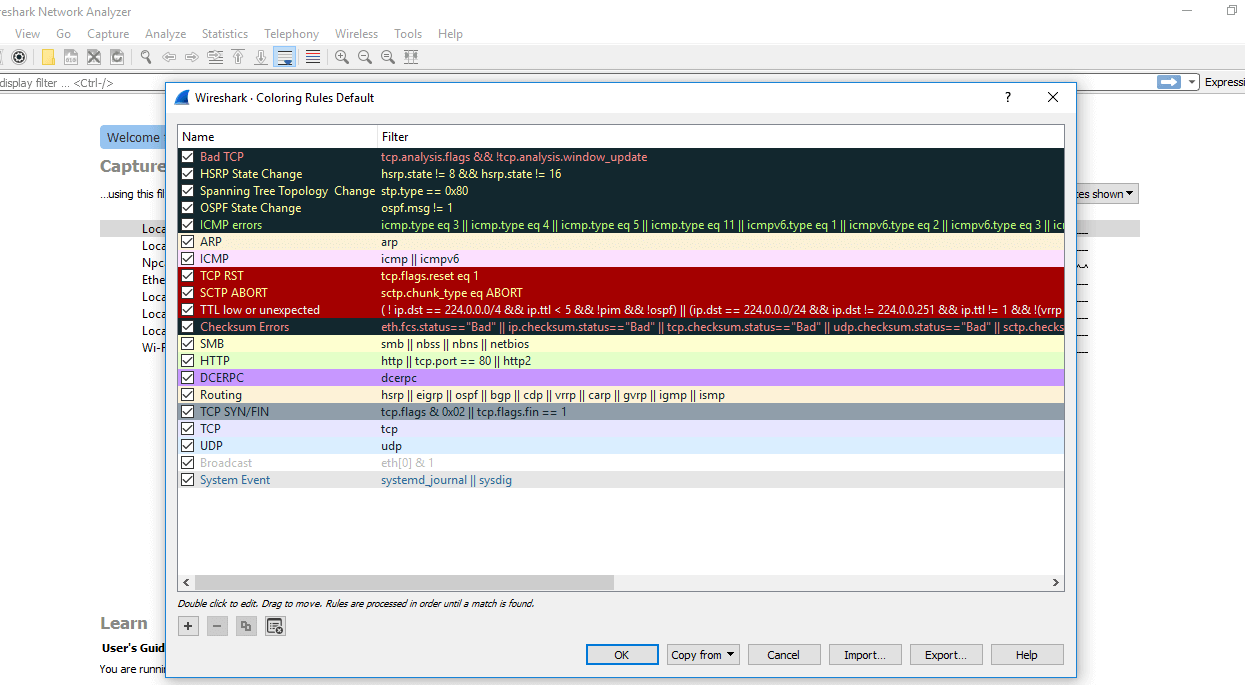
For the network administrator job, advanced knowledge of Wireshark is considered as the requirements. So, it is essential to understand the concepts of the software. It contains these 20 default coloring rules which can be added or removed according to the requirements.
Select the option ‘View‘ and then choose ‘Colorize Packet List,’ which is used to toggle the color on and off.
Note: If you are not sure about the version of your desktop or the laptop, then you can download the 32-bit Wireshark which will run almost 99% on every type of computers
Now let’s start with this basics-
Basic concepts of the Network Traffic
IP Addresses: It was designed for the devices to communicate with each other on a local network or over the Internet. It is used for host or network interface identification. It provides the location of the host and capacity of establishing the path to the host in that network. Internet Protocol is the set of predefined rules or terms under which the communication should be conducted. The types of IP addresses are IPv4 and IPv6.
- IPv4 is a 32-bit address in which each group represents 8 bits ranging from 0 to 255.
- IPv6 is a 128-bit address.
IP addresses are assigned to the host either dynamically or static IP address. Most of the private users have dynamic IP address while business users or servers have a static IP address. Dynamic address changes whenever the device is connected to the Internet.
Computer Ports: The computer ports work in combination with the IP address directing all outgoing and incoming packets to their proper places. There are well-known ports to work with like FTP (File Transfer Protocol), which has port no. 21, etc. All the ports have the purpose of directing all packets in the predefined direction.
Protocol: The Protocol is a set of predefined rules. They are considered as the standardized way of communication. One of the most used protocol is TCP/IP. It stands for Transmission Control Protocol/ Internet Protocol.
OSI model: OSI model stands for Open System Interconnect. OSI model has seven layers, namely, Application layer, Presentation layer, Session layer, Transport layer, Network layer, Data link layer, and the physical layer. OSI model gives a detail representation and explanation of the transmission and reception of data through the layers. OSI model supports both connectionless and connection-oriented communication mode over the network layer. The OSI model was developed by ISO (International Standard Organization).
Most used Filters in Wireshark
Whenever we type any commands in the filter command box, it turns green if your command is correct. It turns red if it is incorrect or the Wireshark does not recognize your command.
Below is the list of filters used in Wireshark:
| Filters | Description |
|---|---|
| ip.addr Example- ip.addr==10.0.10.142 ip.src ip.dst | It is used to specify the IP address as the source or the destination. This example will filter based on this IP address as a source and a destination. If we want for a particular source or destination then, It is used for the source filter. It is used for the destination. |
| protocol Example- dns or http ‘Dns and http’ is never used. | This command filters based on the protocol. It requires the packet to be either dns protocol or http protocol and will display the traffic based on this. We would not use the command ‘dns and http’ because it requires the packet to be both, dns as well as http, which is impossible. |
| tcp.port Example: tcp.port==443 | It sets filter based on the specific port number. It will filter all the packets with this port number. |
| 4. udp.port | It is same as tcp.port. Instead, udp is used. |
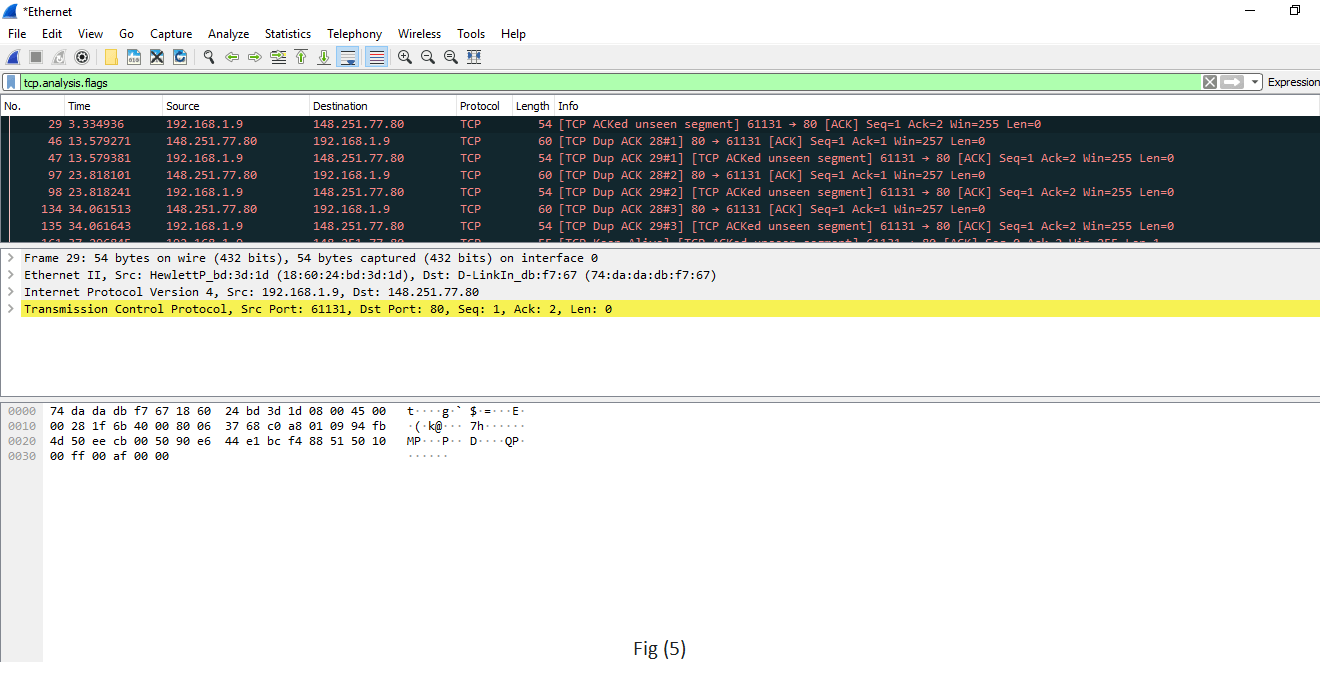
| tcp.analysis.flags example is shown in fig(5). | Wireshark can flag TCP problems. This command will only display the issues that Wireshark identifies. Example, packet loss, tcp segment not captured, etc. are some of the problems. It quickly identifies the problem and is widely used. |
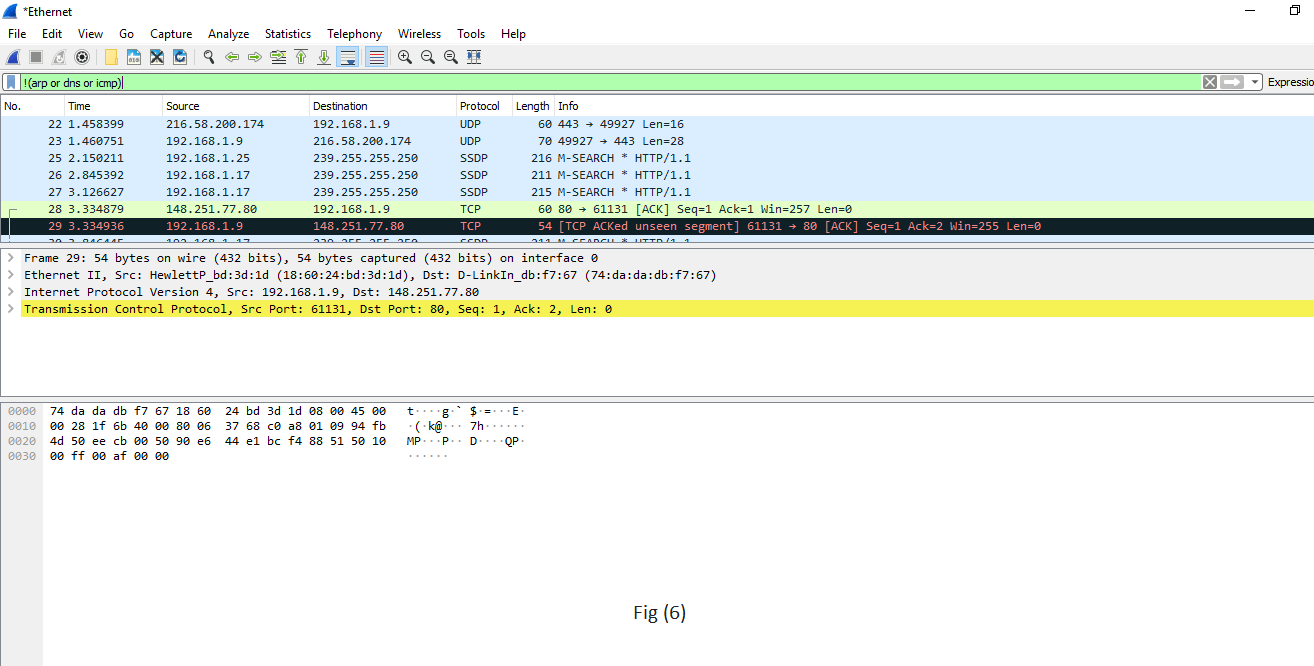
| 6.!() For example, !(arp or dns or icmp) This is shown in fig (6). | It is used to filter the list of protocols or applications, in which we are not interested. It will remove arp, dns, and icmp, and only the remaining will be left or it clean the things that may not be helpful. |
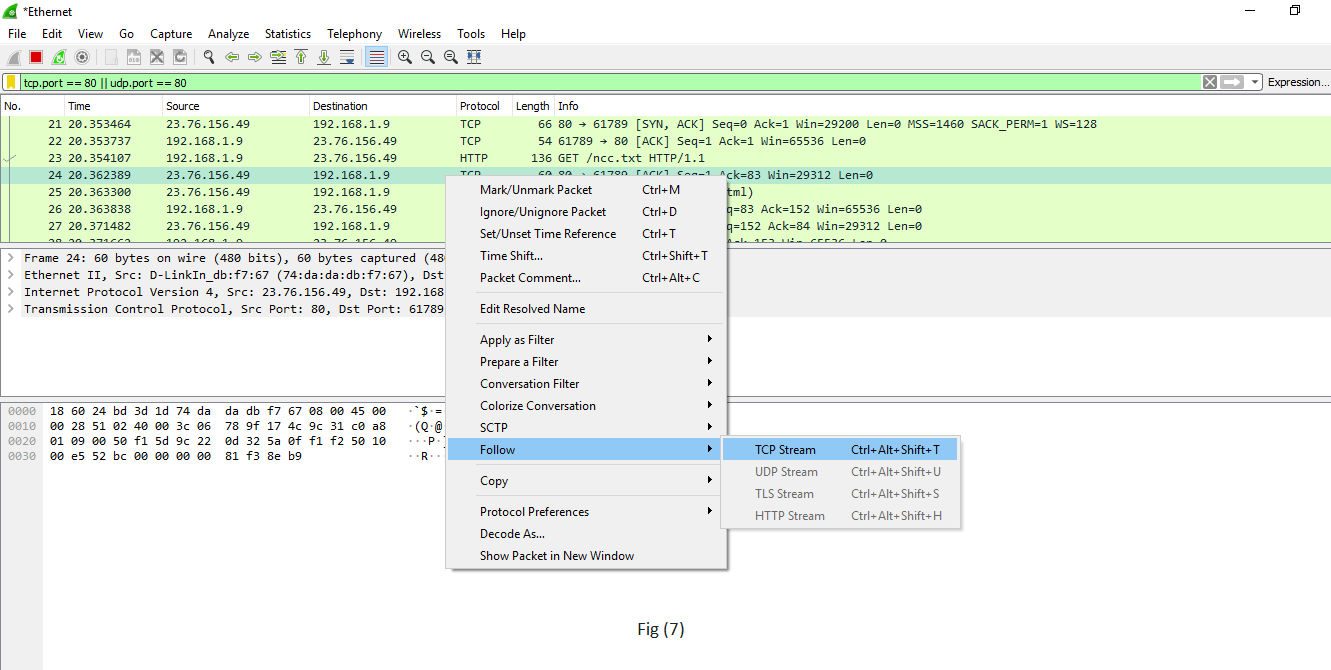
| Select any packet. Right-click on it and select ‘Follow’ and then select’ TCP stream.’ Shown in fig. (7). | It is used if you want to work on a single connection on a TCP conversation. Anything related to the single TCP connection will be displayed on the screen. |
| tcp contains the filter For example- tcp contains Facebook Or udp contains Facebook | It is used to display the packets which contain such words. In this, Facebook word in any packet in this trace file i.e., finding the devices, which are talking to Facebook. This command is useful if you are looking for a username, word, etc. |
| http.request For the responses or the response code, you can type http.response.code==200 | It will display all the http requests in the trace file. You can see all the servers, the client is involved. |
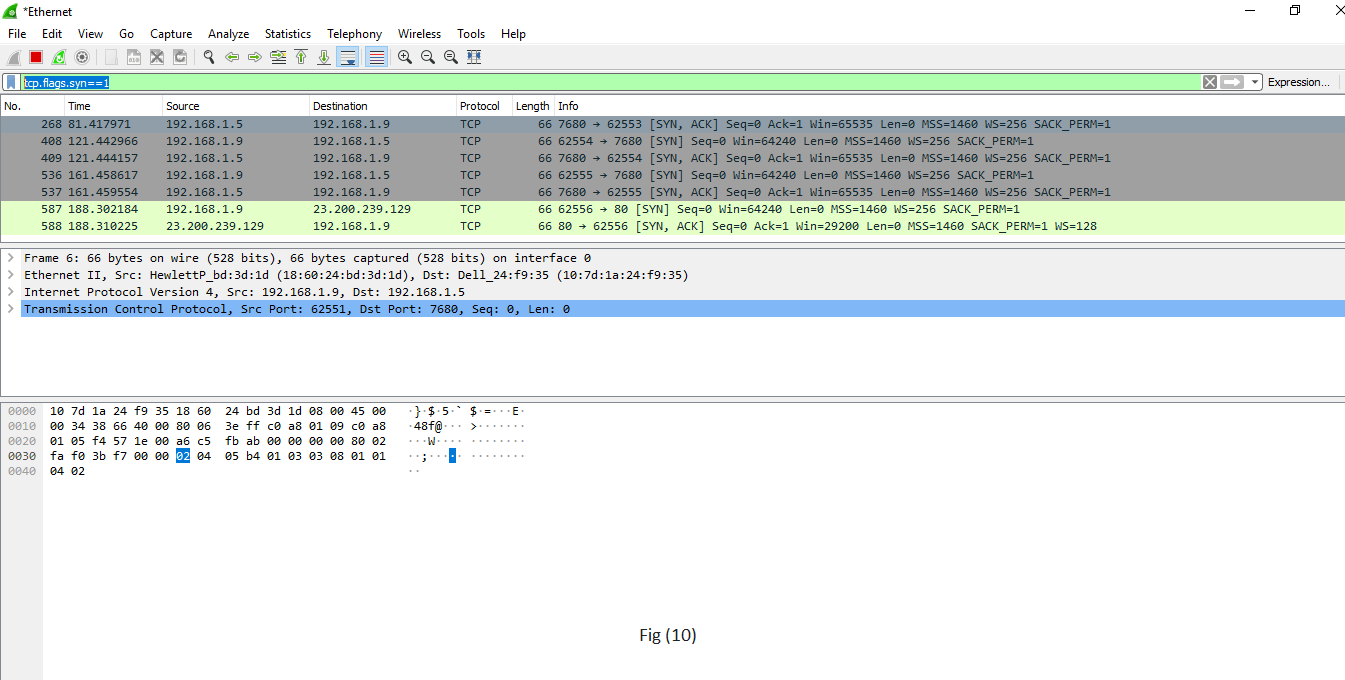
| tcp.flags.syn==1 This is shown in fig (10). tcp.flags.reset | This will display all the packets with the sync built-in tcp header set to 1. This will show all the packets with tcp resets. |
Wireshark packet sniffing
Wireshark is a packet sniffing program that administrators can use to isolate and troubleshoot problems on the network. It can also be used to capture sensitive data like usernames and passwords. It can also be used in wrong way (hacking) to ease drop.
Packet sniffing is defined as the process to capture the packets of data flowing across a computer network. The Packet sniffer is a device or software used for the process of sniffing.
Below are the steps for packet sniffing:
- Open the Wireshark Application.
- Select the current interface. Here in this example, interface is Ethernet that we would be using.
- The network traffic will be shown below, which will be continuous. To stop or watch any particular packet, you can press the red button below the menu bar.
Apply the filter by the name ‘http.’ After the filter is applied, the screen will look as:
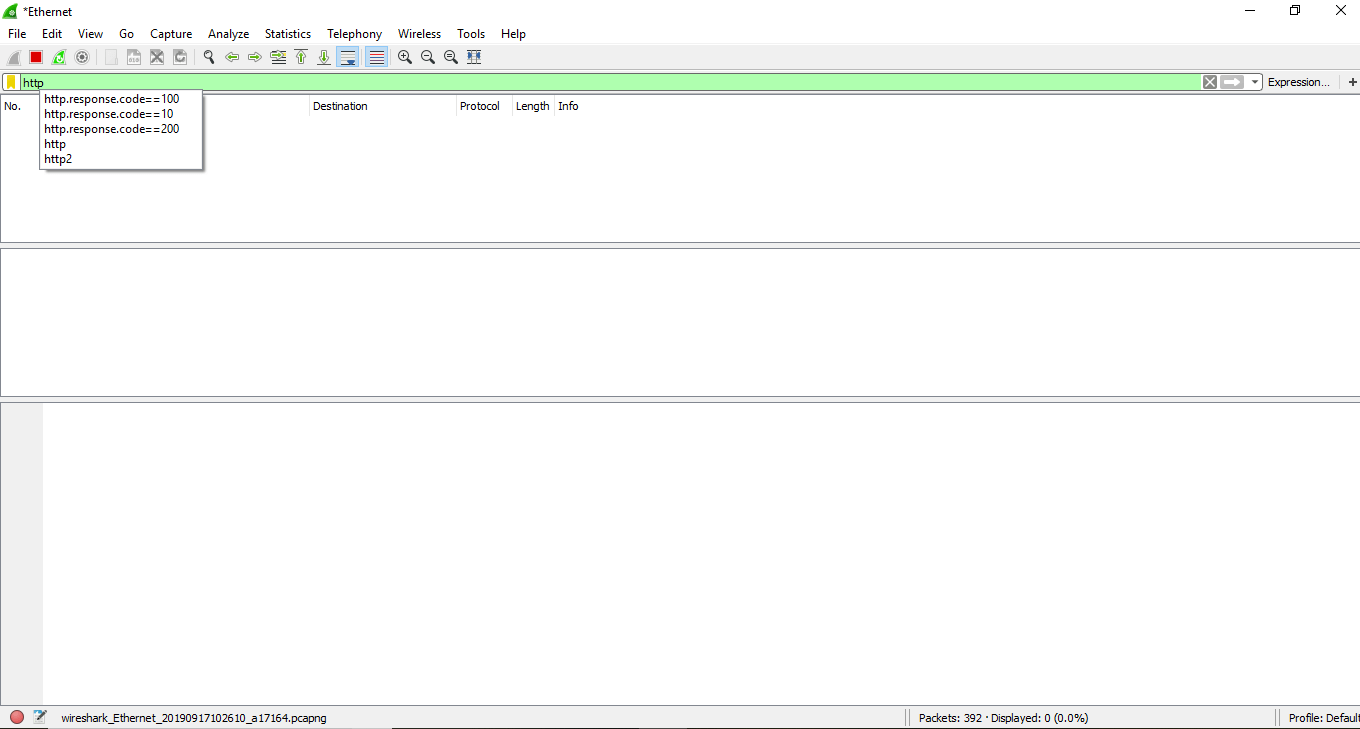
The above screen is blank, i.e.; there is no network traffic as of now.
Open the browser. In this example, we have opened the ‘Internet Explorer.’ You can choose any browser.
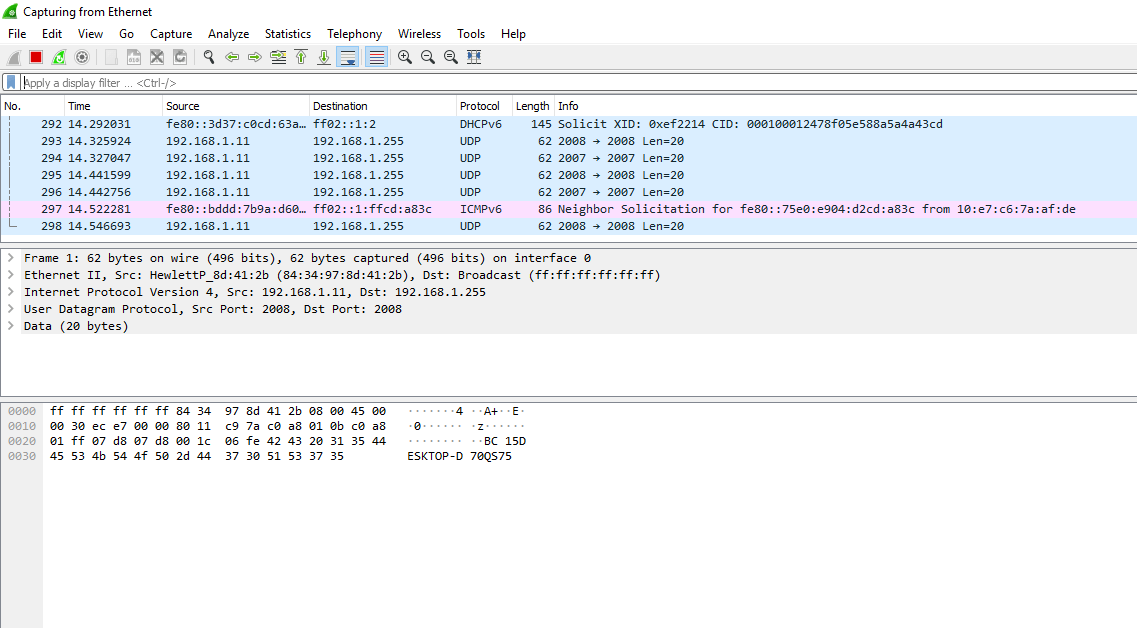
As soon as we open the browser, and type any address of the website, the traffic will start showing, and exchange of the packets will also start. The image for this is shown below:
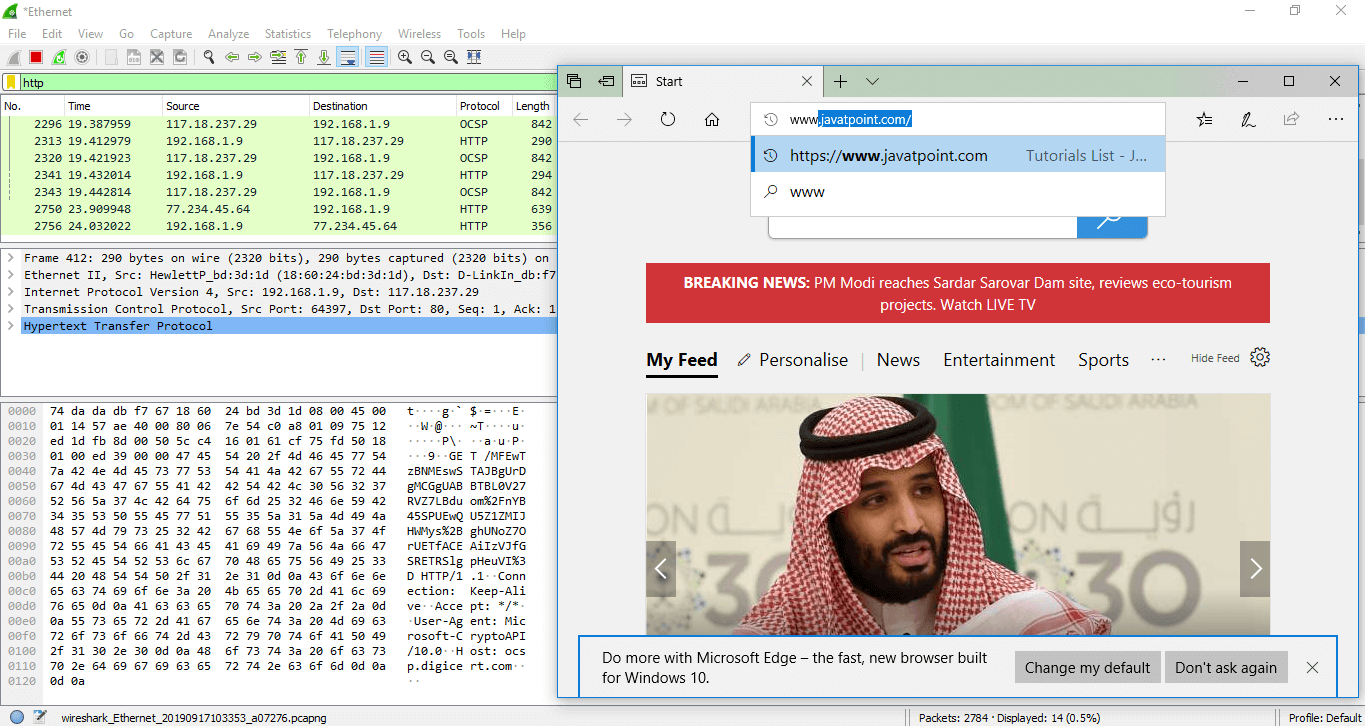
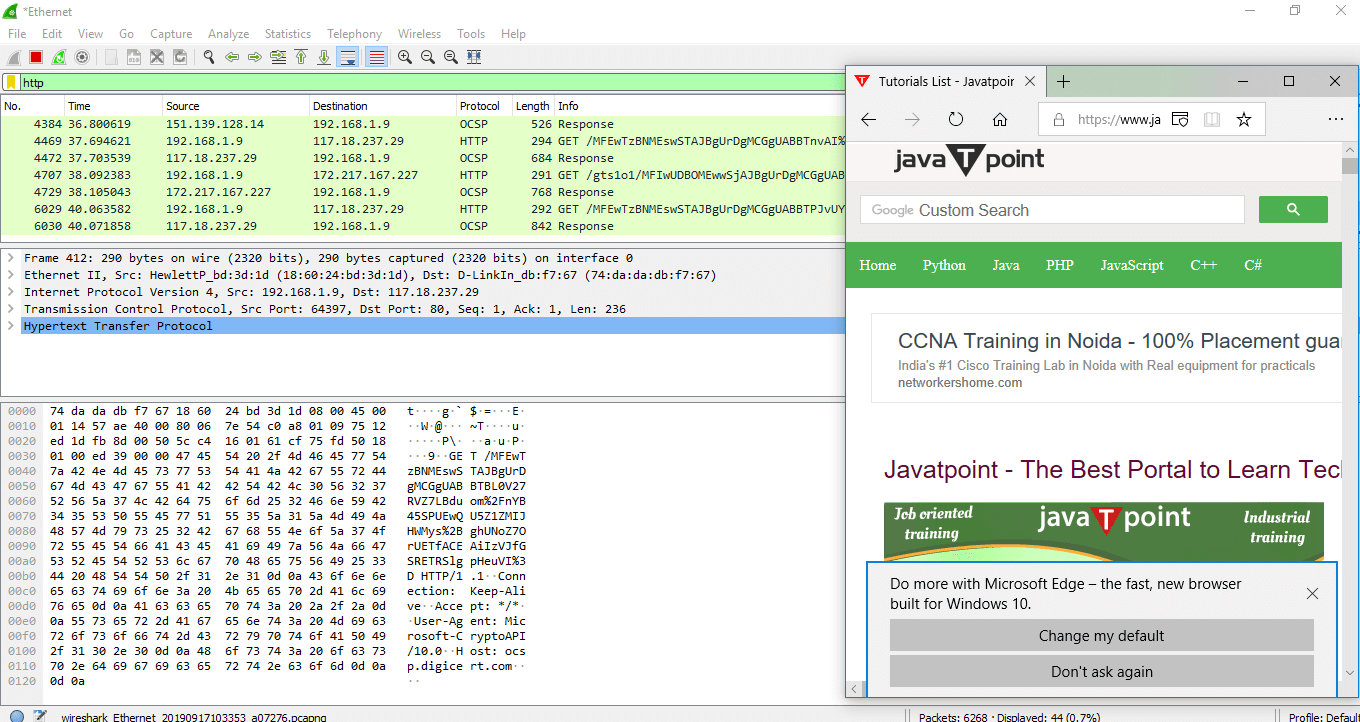
The above process explained is called as packet sniffing.
Username and password sniffing
It is the process used to know the passwords and username for the particular website. Let’s take an example of gmail.com. Below are the steps:
- Open the Wireshark and select the suitable interface.
- Open the browser and enter the web address. Here, we have entered gmail.com, which is highly secured. Enter your email address and the password. The image is shown below:
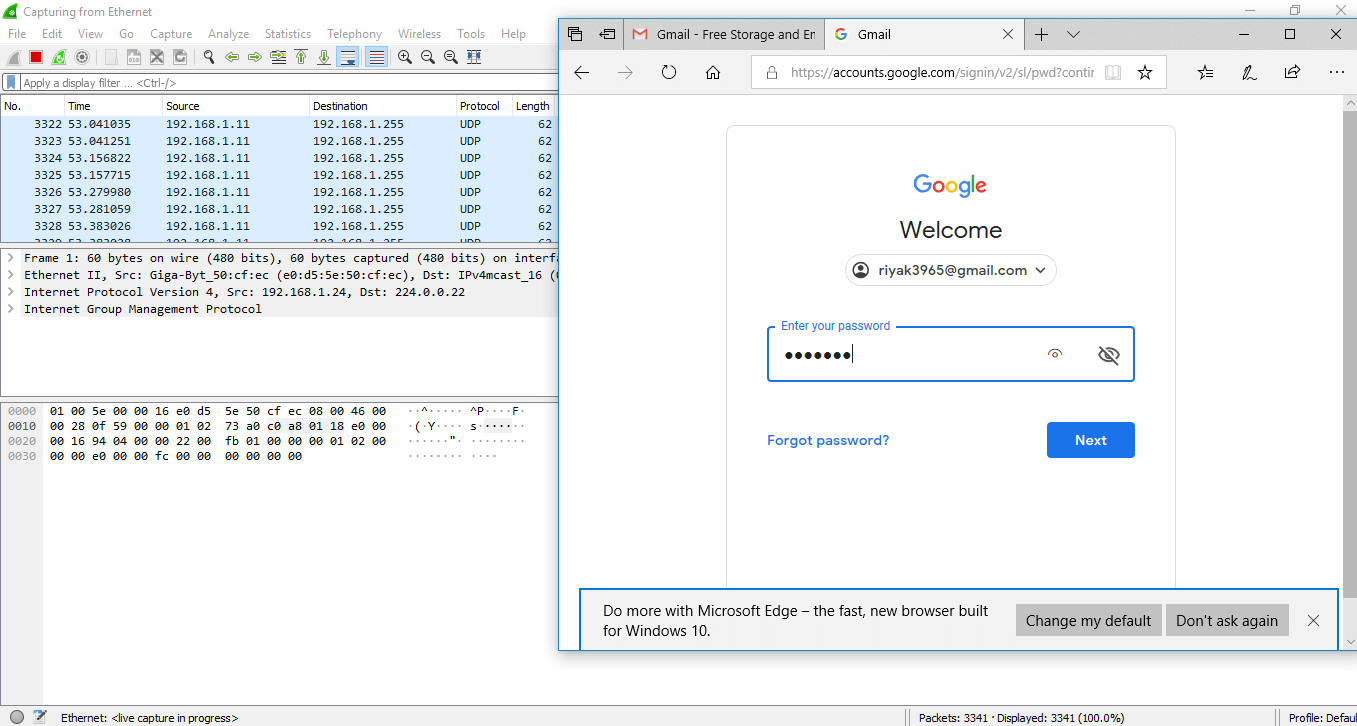
- Now, go to the Wireshark and on the filters block, enter ‘frame contains gmail.com.’ Then you can see some traffic.
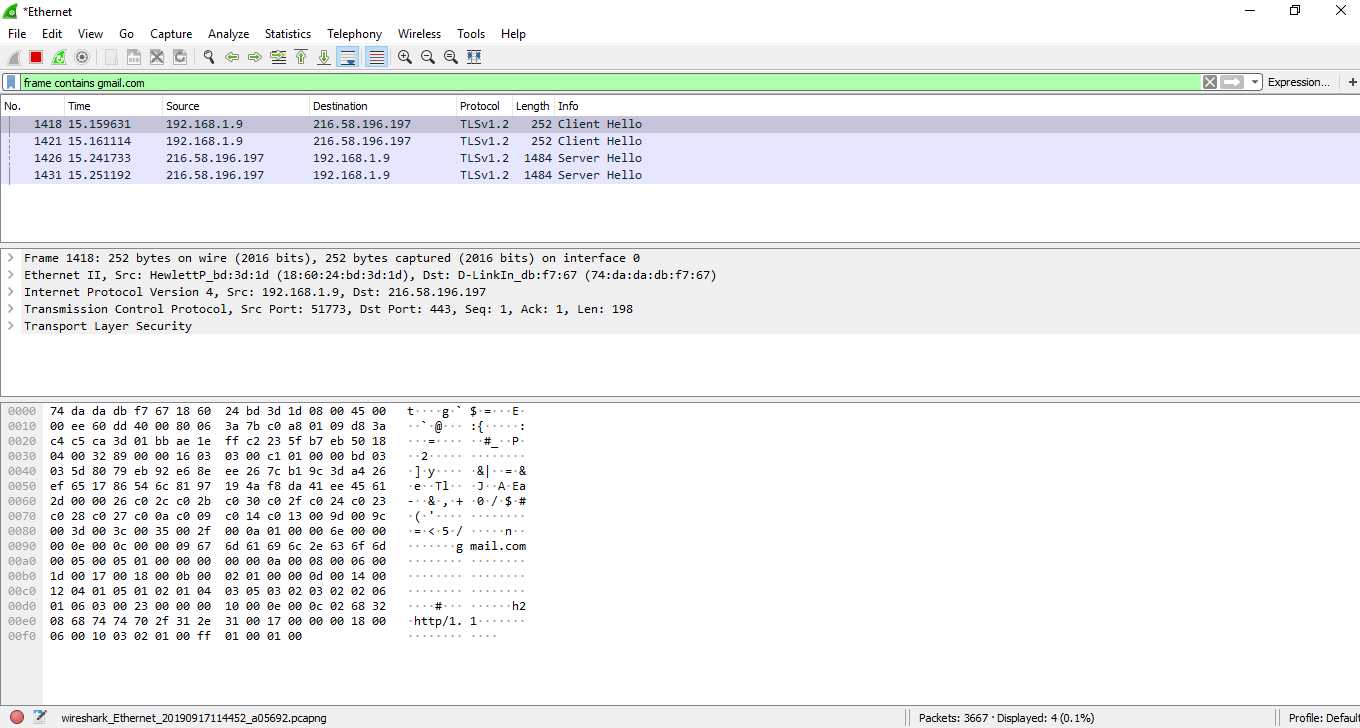
- Right-click on the particular network and select ‘Follow’, and then ‘TCP Stream.’ You can see that all the data is secured in the encrypted form.
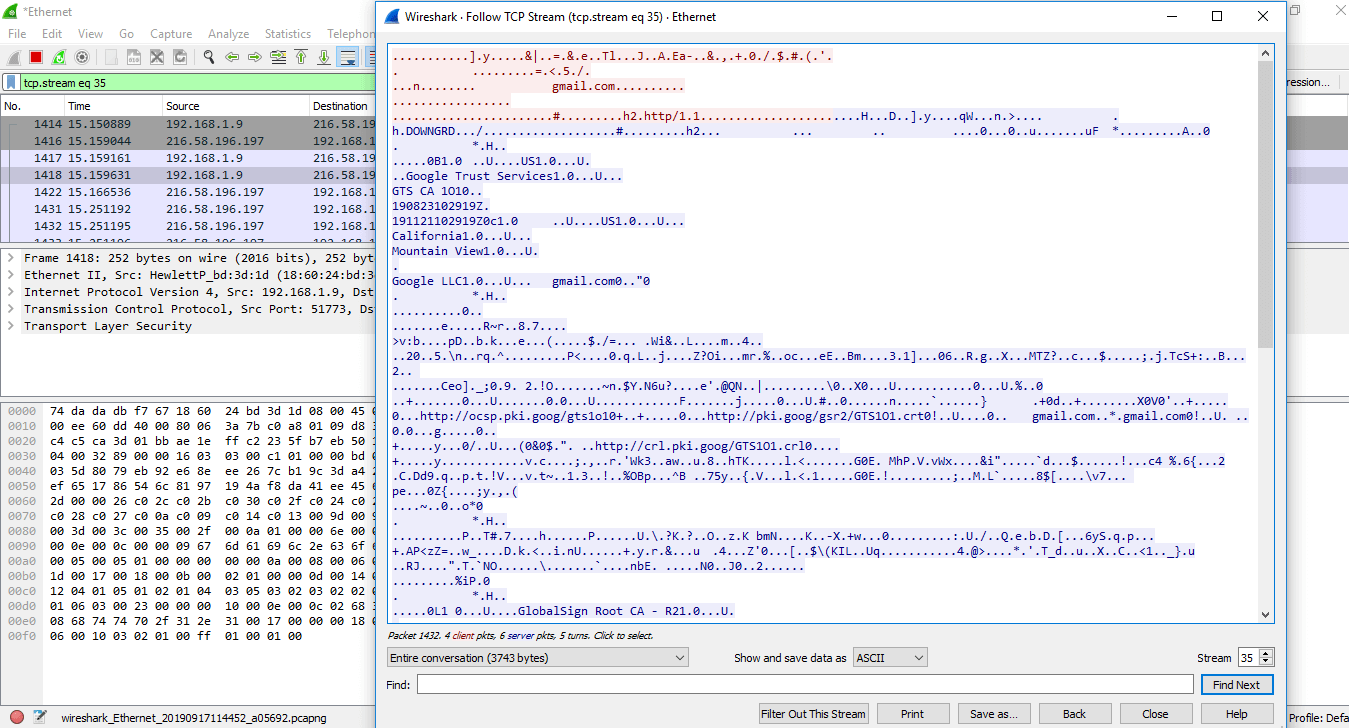
In the arrow shown above, the ‘show and save data as’ has many choices. These options are- ASCII, C Arrays, EBCDIC (Extended Binary Coded Decimal Interchange Code), etc. EBCDIC is used in mainframe and mid-range IBM computer operating systems.
Wireshark Statistics
The Wireshark provides a wide domain of statistics. They are listed below:
Below is the list of statistics of Wireshark along with the description:
| Capture file properties | It includes file, time, capture, interfaces (current interface in use), and Statistics (measurements). |
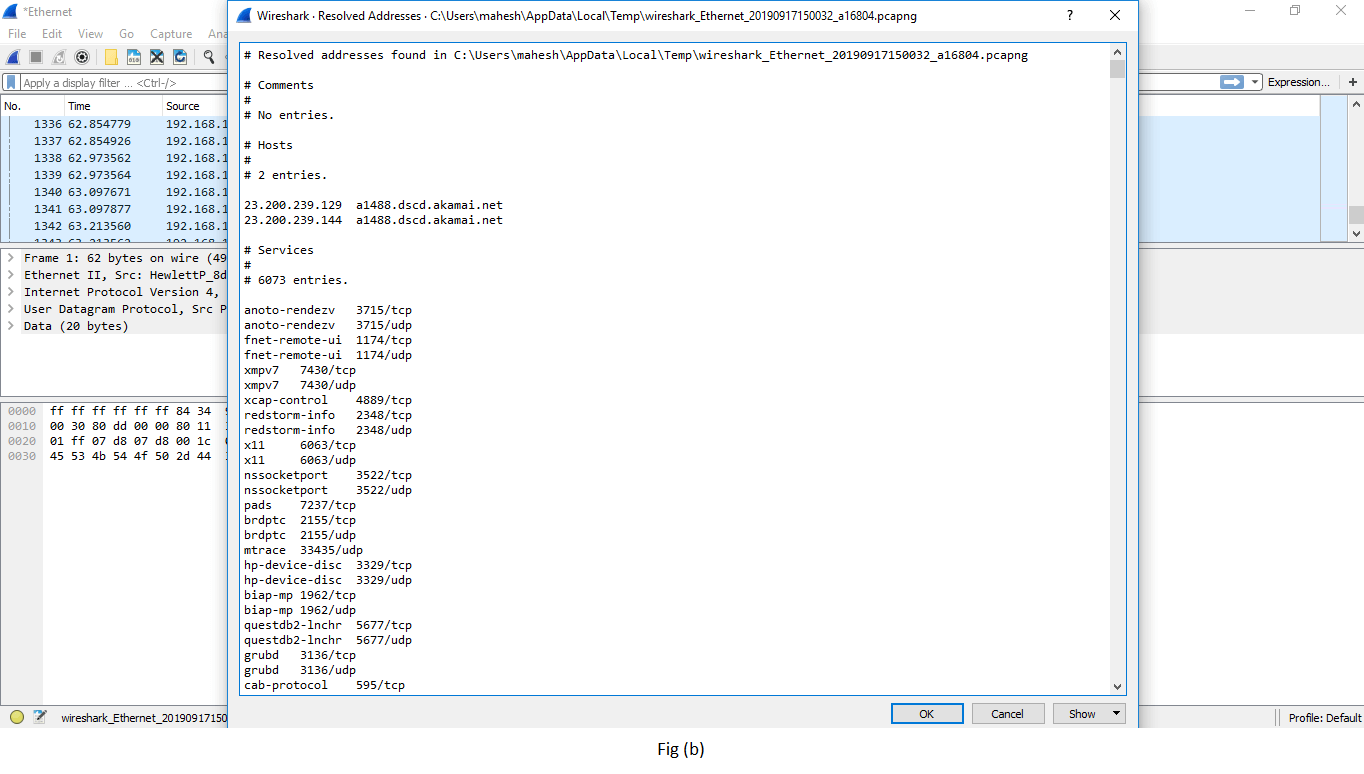
| Resolved addresses | This option includes all the types of the Top IP addresses and DNS that were resolved in your packet capture. It gives the idea of the different accessed resources during the packet capture process. It is shown in fig (b). |
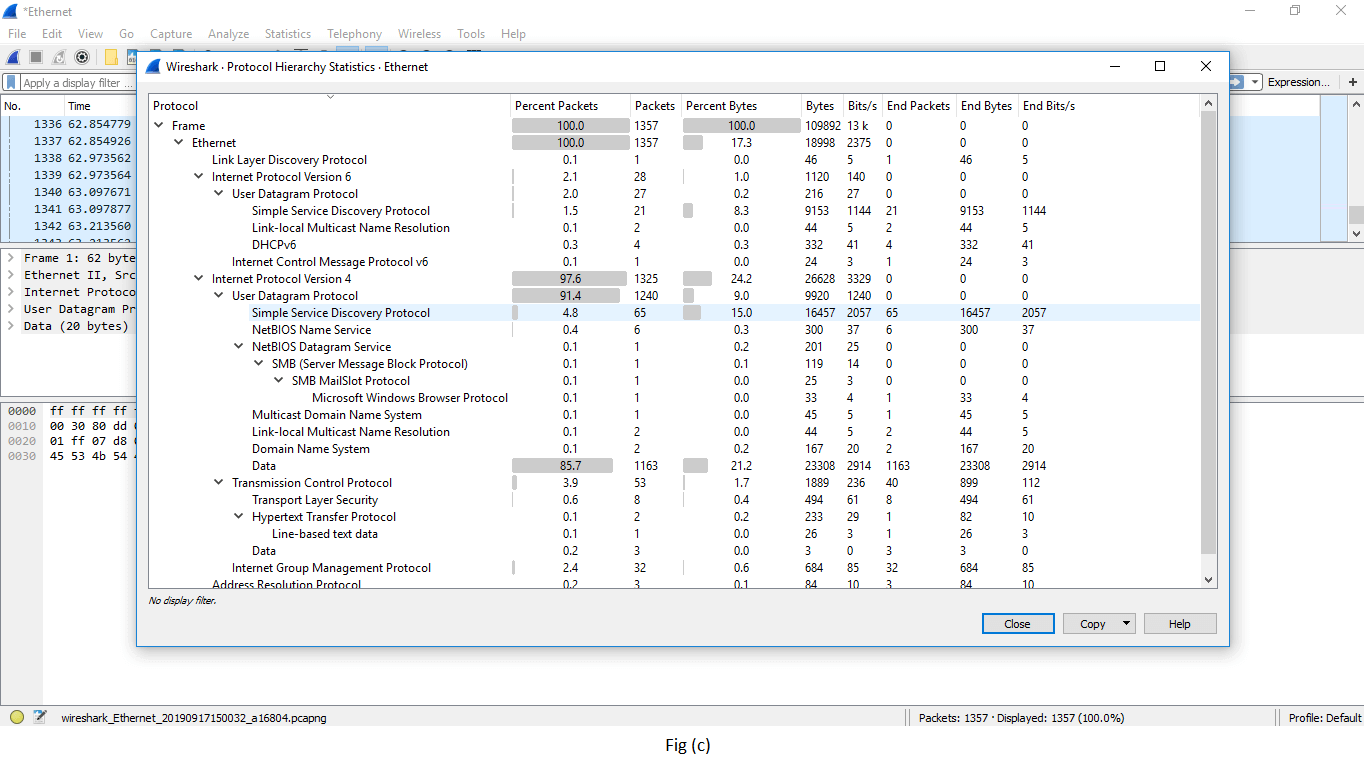
| Protocol hierarchy | It is named as the tree of all the protocols listed in the capture process. The image is shown above in fig (c). |
| Conversations | Each row of the list gives the statistical value of a particular conversation. |
| Endpoints | It is defined as a logical endpoint of the separate protocol traffic of the specified protocol layer. For example0 IP address will send and receive all types of the packet to the particular IP addresses. |
| Packet lengths | It simply displays the characteristics of different packets lengths determined in the network.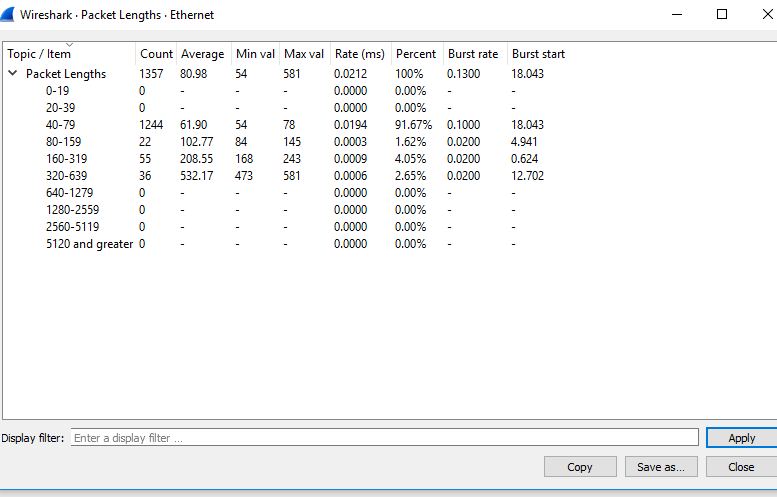 |
| I/O Graphs | It is the term used to display the graph of the captured packets. You can also apply filters during this process. The process is explained below in detail. |
| Service Response Time | It is the type of information which is available for many protocols. It is defined as the time it takes between the request and the response time. The protocol for which this service is available are: AFP (Apple Filing Protocol) CAMEL DCE-RPC DIAMETER FC (Fiber Channel) GTP (GPRS Tunneling Protocol) H.225 RAS LDAP (Lightweight Directory Access Protocol) MEGACO MGCP (Media Gateway Control Protocol) NCP (NetWare Core Protocol) ONC-RPC RADIUS SCSI SMB (Server Message Block Protocol) SMB2 (Server Message Block Protocol version 2) |
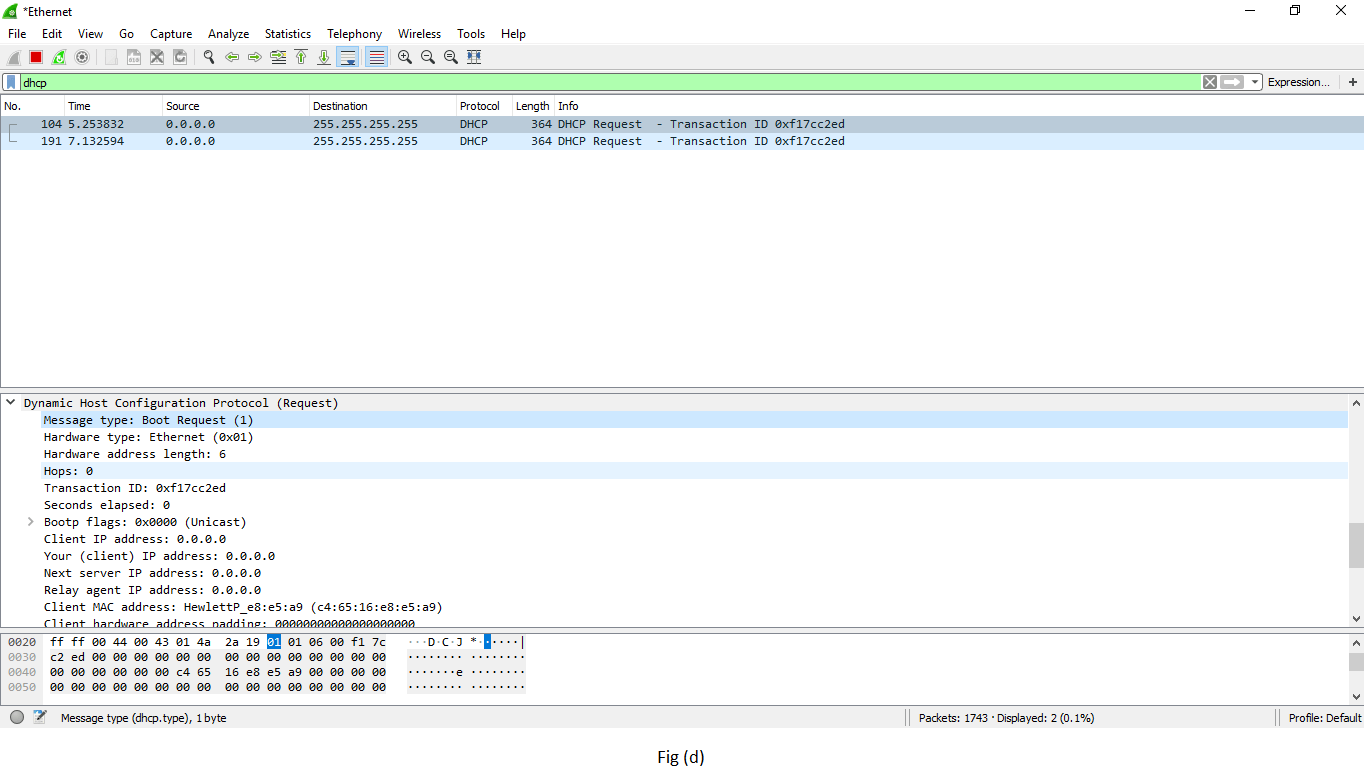
| DHCP (BOOTP) Statistics | It is implemented as the option of BOOTP. DHCP is client/server protocol, dynamically used to assign IP addresses to a DHCP client. If DHCP does not work, then some computer system uses APIPA (Automatic Private IP Address) to assign the IP addresses. |
| ONC-RPC Programs | It stands for Open Network Computing- Remote Procedure Call. It can use TCP and UDP as its transport protocol. ONC-RPC cannot be applied directly to filter in a capture process, but you can use TCP or UDP to filter on that one. It is shown in fig (d). |
| 29West | It is defined as ULLM technology. It stands for Ultra-Low Latency Messaging. |
| ANCP | It stands for Access Node Control Protocol. It is an L2CP (Layer 2 Control Protocol) and a TCP based one. It has its adjacency layer which decides the messages exchange by the ANCP endpoints with the use of ‘Capabilities.’ |
| BACnet | It was designed specially to meet the communication needs of control systems and building automation. It is used for applications such as fire detecting systems, light control, etc. It provides the structure to exchange information despite the particular building service it performs. |
| Collectd | It is used to monitor the traffic on the specific TCP port. |
| DNS | It stands for Domain Name Server, which gives a detailed analysis of the DNS traffic. It provides the list of the codes returned in DNS. You can also view the errors through the traffic. |
| Flow-graph | It is a method to check connections between the client and the server. It is an efficient way to verify the connections between two endpoints. It also assists us with troubleshooting capabilities. |
| HART-IP | It gives the detail for the response, request, publishes, and error packets. It stands for Highway Addressable Remote Transducer over IP stats. |
| HPFEEDS | It determines the ‘payload size per channel and Opcodes.’ |
| HTTP | It has four options:
|
| HTTP2 | It is the HTTP version 2. |
| Sametime | It is used to analyze the slow network traffic when the server and client have the sametime. |
| TCP Stream Graphs | It is explained below in detail: |
| UDP Multicast Streams | Through this command, stream parameters and burst parameters can be set. It includes OSPF, IGMP, and video streams. |
| F5 | It includes the virtual server distribution and the tmm distribution. It specifies the tcpdump commands. |
| IPv4 Statistics IPv6 Statistics | These options determine all addresses, destination and ports, IP protocol types, and the source and destination address. |
I/O GRAPHS
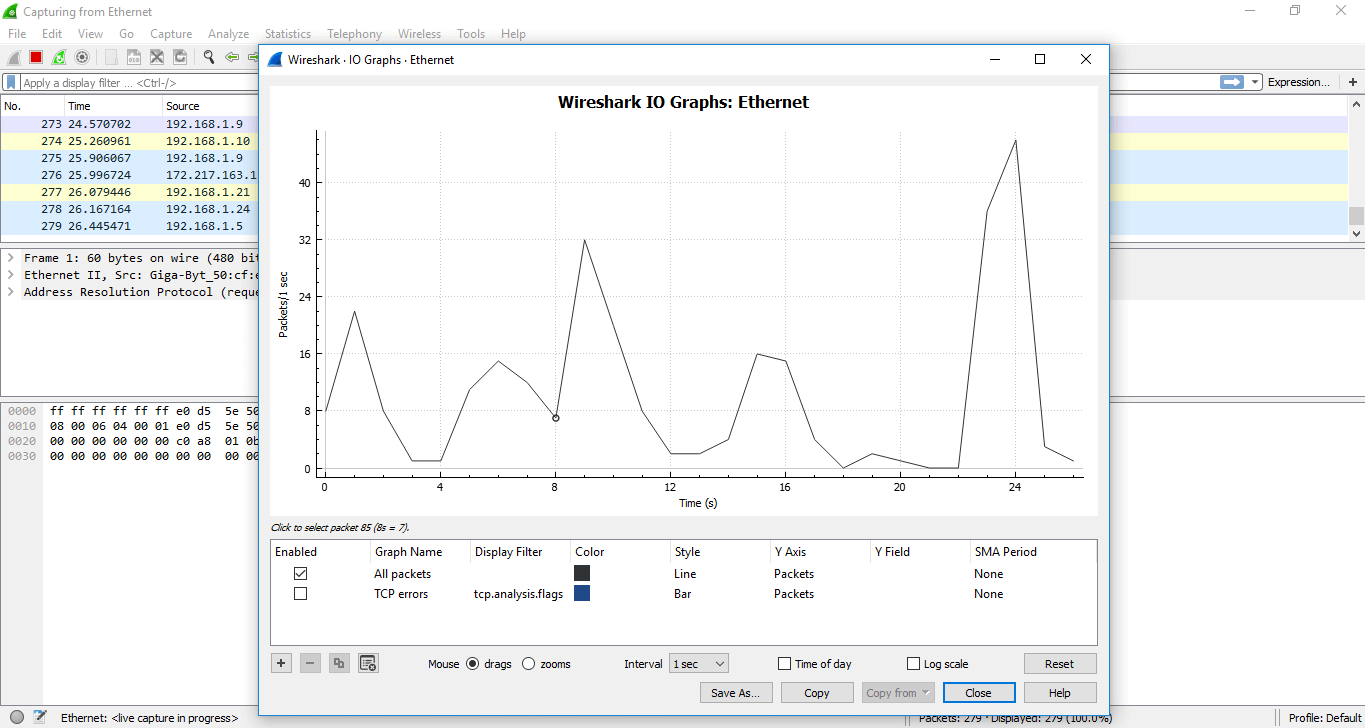
It shows the graph for the network traffic. The graph will look similar but changes as per the traffic involved. There is a table below the figure, which has some filters. Using the ‘+’ sign, you can add more filters and use ‘-sign you can remove the existing filters. You can also change the color. For every particular filter, you can add a colored layer, which increases the visibility of the graph.
The tick option under the ‘Enabled,’ displays the layer according to your requirements.
For example, we have applied the filter ‘TCP errors’ and the changes can be viewed easily. The image is shown below:
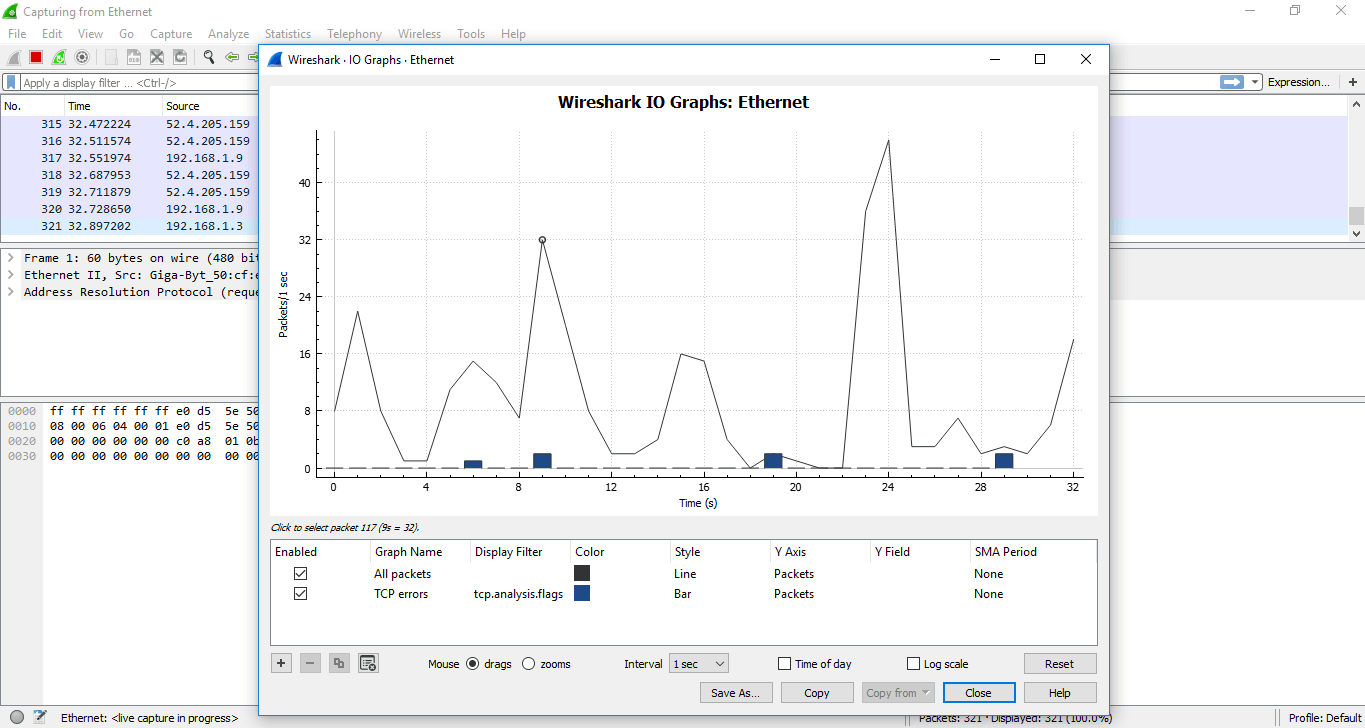
If you click on the particular point on the graph, you can watch the corresponding packet will be shown on the screen of the network traffic. You can also apply a filter on the particular port.
Another category of the graph comes under the option ‘TCP Stream graphs.’
It gives the visualization of the TCP sequence number with time.
Below are the steps to understand the TCP Stream graphs:
- Open the Wireshark. Click on the interface to watch the network traffic.
- Apply the filter as ‘tcp.’
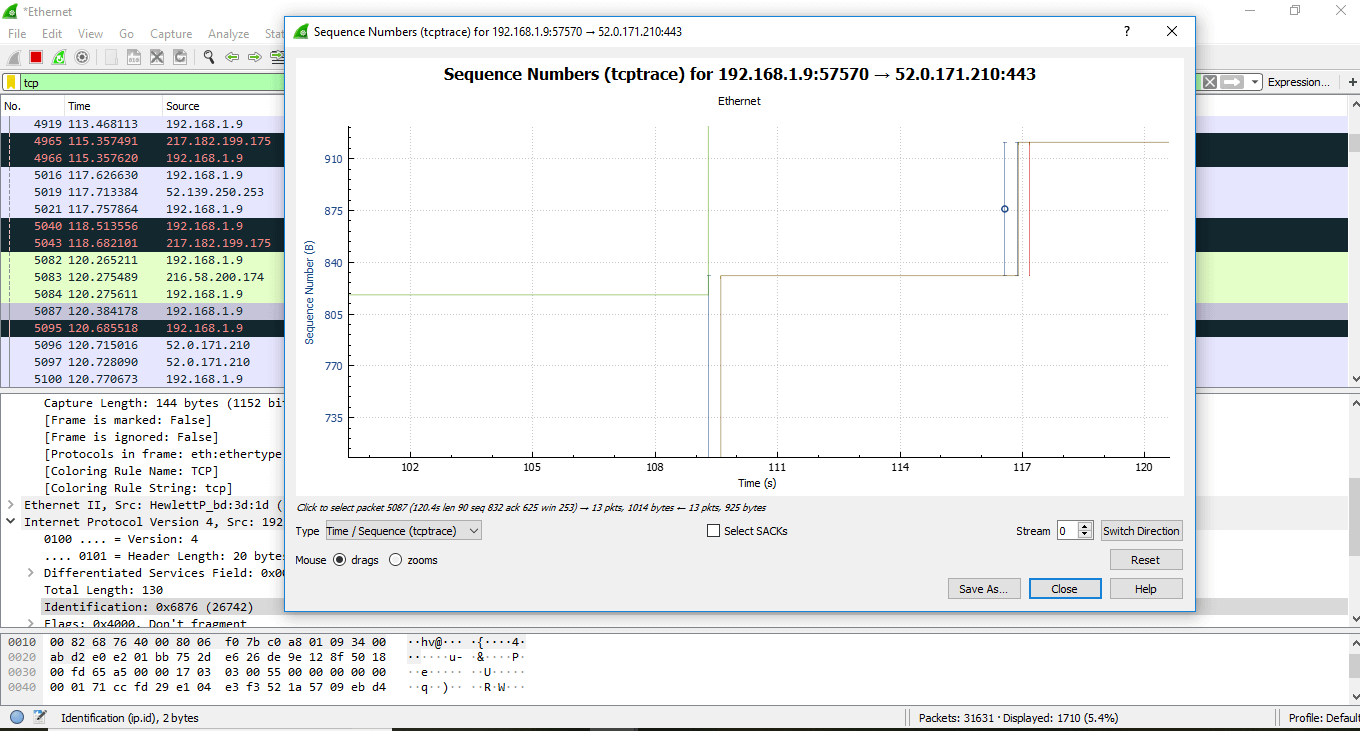
- Click on the option ‘Statistics ‘on the menu bar and select ‘TCP Stream graphs‘ and select ‘Time sequence (tcptrace). You can also choose other options in the ‘TCP Stream graphs’ category depending on your requirements. Now the screen will look as:
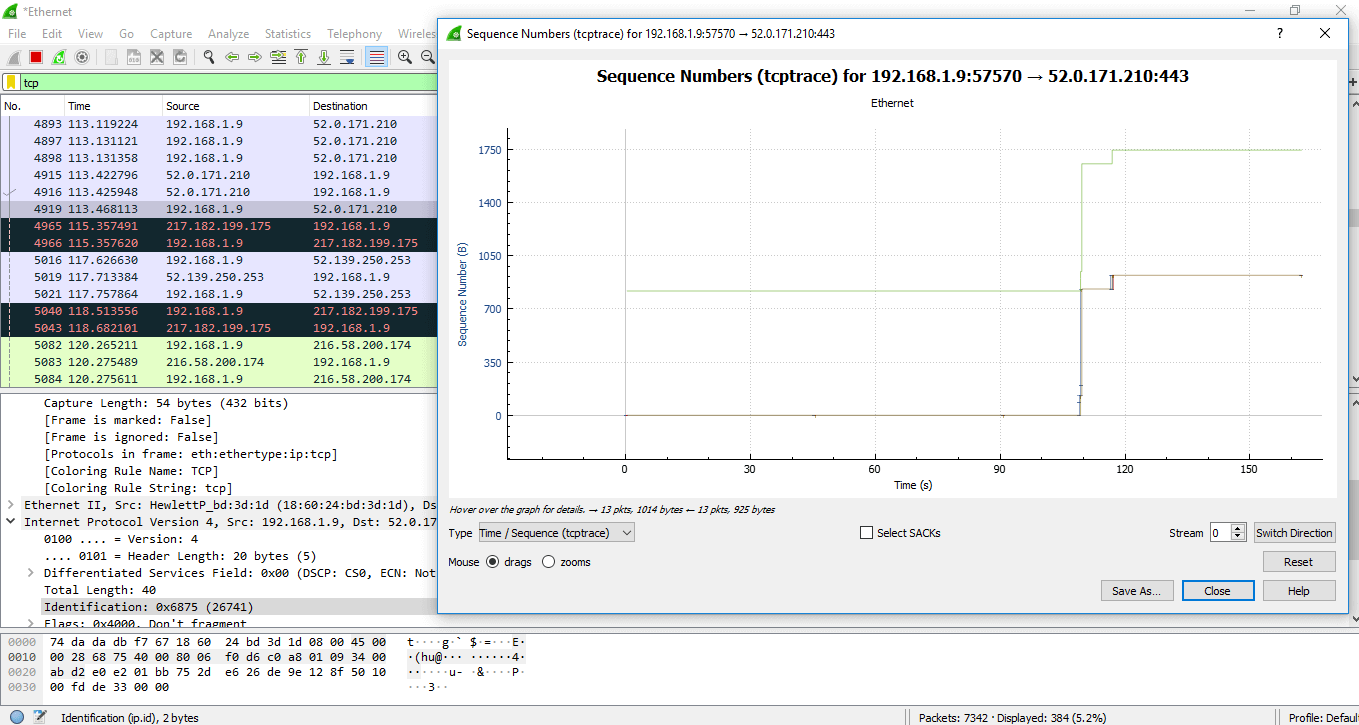
Now, as you zoom on the graph, you will notice the points in detail. The lines shown are the packets. The length along the Y-axis shows how big the packet is. You can also see the green line going up and then comes at the same level. This means that the data has been ACK (Acknowledged). Here going up means that more data is being sent.
The data is being sent and then ACK, this is the proper use of the TCP. The flat line here signifies that nothing is happening.
The green line above is called ‘received window.’ The gap between the received window and the packet, defines how much space is in the received buffer.
FACTS ABOUT WIRESHARK/ IMPORTANT STEPS/ MOST USED
Below are the facts or points implemented in real life:
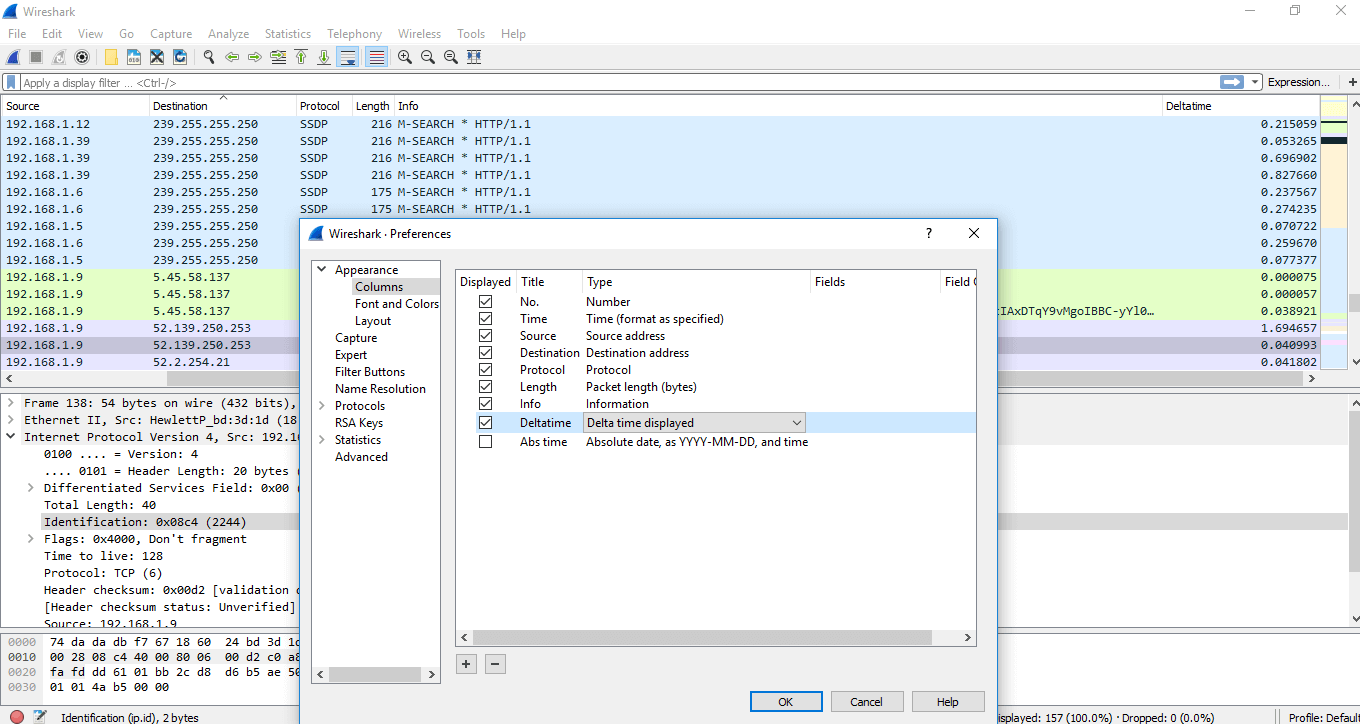
Adding a delta column: To add any column, below are the steps:
- On any of the column menu, right-click and choose ‘Column Preferences’ and then select ‘Column.’
- Click on the ‘+’ sign, and add the column by name like delta-time and under the ‘Type’ category, select the delta time or delta time displayed.
- When you are capturing your data, analyze the problem, you will get the three-way handshake.
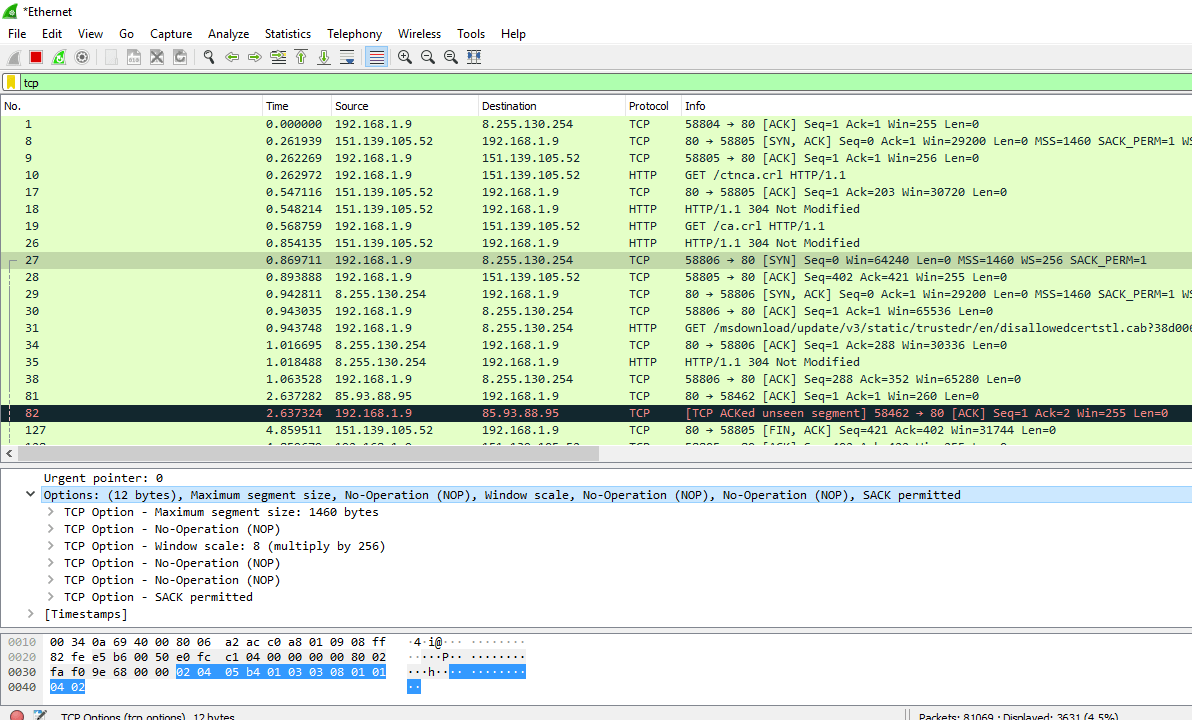
- It contains good options like the TCP options.
- From this, you can determine the shift time and figure out if you have captured packets on the client-side or the server-side. There is a little delay between SYN and SYN- ACK packet at server-side while there is a more delay between the SYN and SYN-ACK at the client-side. There is a delay at the server-side only between the SYN-ACK and ACK. The SYN has to reach to the client. After the three-way handshake, the data has to reach the server.
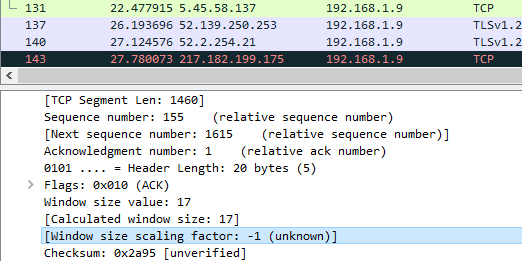
- ou can also notice the difference in the TCP options between the SYN and SYN-ACK packets. The window scaling factor is also essential, as shown below:
- One sequence number means 1 byte of data. It also has an importance of the TCP Stream Graphs which is already explained above.
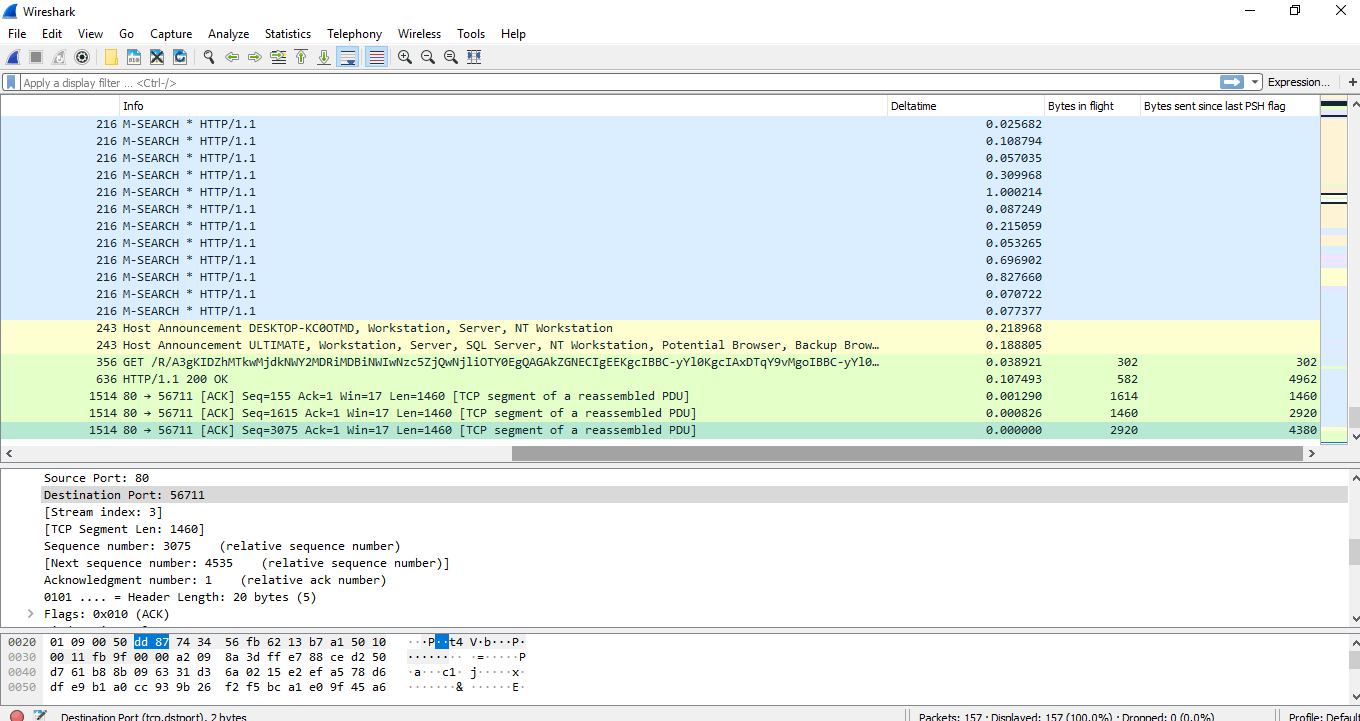
- Under the TCP options, capture window, you can see the information about the ‘PSH byte’ and ‘Bytes in flight.’ Right-click on that and choose ‘Apply as Column.’ You can see both the columns and data according to it. The image for this is shown below:
- In TCP Header, three-way handshake MSS (Maximum Header Size) means that the maximum amount of data it can receive of TCP payload. The image is shown below:
- MSS 1460 implies that this is per packet amount of data. This size varies from packet to packet. Something like a router, firewall, etc. will do MSS clamping because it knows what is going forward. It checks the value greater than 8000 bytes and brings down it to an appropriate level so that it can go across without fragmentation or being dropped.
- The data with the 0 is the ax coming back in the capture window. You can notice that the data and ACK are different at each point. If we are on the acknowledgment side, we know that we have to send the ACK after two packets. A sender can send X amount of packets depending on its congestion window. A sender can send packets at once also. After the packets will go at the receiver and then the acknowledgment comes back. The sender can send all packets before the ACK reaches it. If the buffer has less space left, then the sender has to send the packets according to space. The ACK arrives on time, and if there is a delay in the ACK, syncing will be delayed. So above it’s, just a perspective example explained.
- We do recommend not to disable the default settings of the TCP and Wireshark unless you know what you?re doing.
- If there are the blank page and slow loading, then it is unusable.
- It is good to capture packets from both ends.
- Lean on your provider when you have the data.
- It is a LIVE CAPTURE software used widely.
- It can also capture packets from a set of captured one’s.
- There are many protocols dissectors.
- The list of commonly used Endpoints or IP endpoints is: Bluetooth (MAC 48-bit addresses), Ethernet, fiber channel, USB, UDP, FDDI, IPv4, IPv6, JXTA, NCP, TCP, etc.
- Name resolutions are used to convert numerical values into the human-readable format. There are two ways- network services resolution and resolve from Wireshark configuration files. It is only possible when capturing is not in progress. It can be resolved after the packet is added to the list. To rebuild the list with correct resolved names you can use View-> Reload.
- In ARP, Wireshark asks the OS to convert the Ethernet address to the IP address.
- Since it is a live capture process, so it is important to set the correct time and zone on your computer.
- Open the Wireshark and then select the particular interface as explained above.
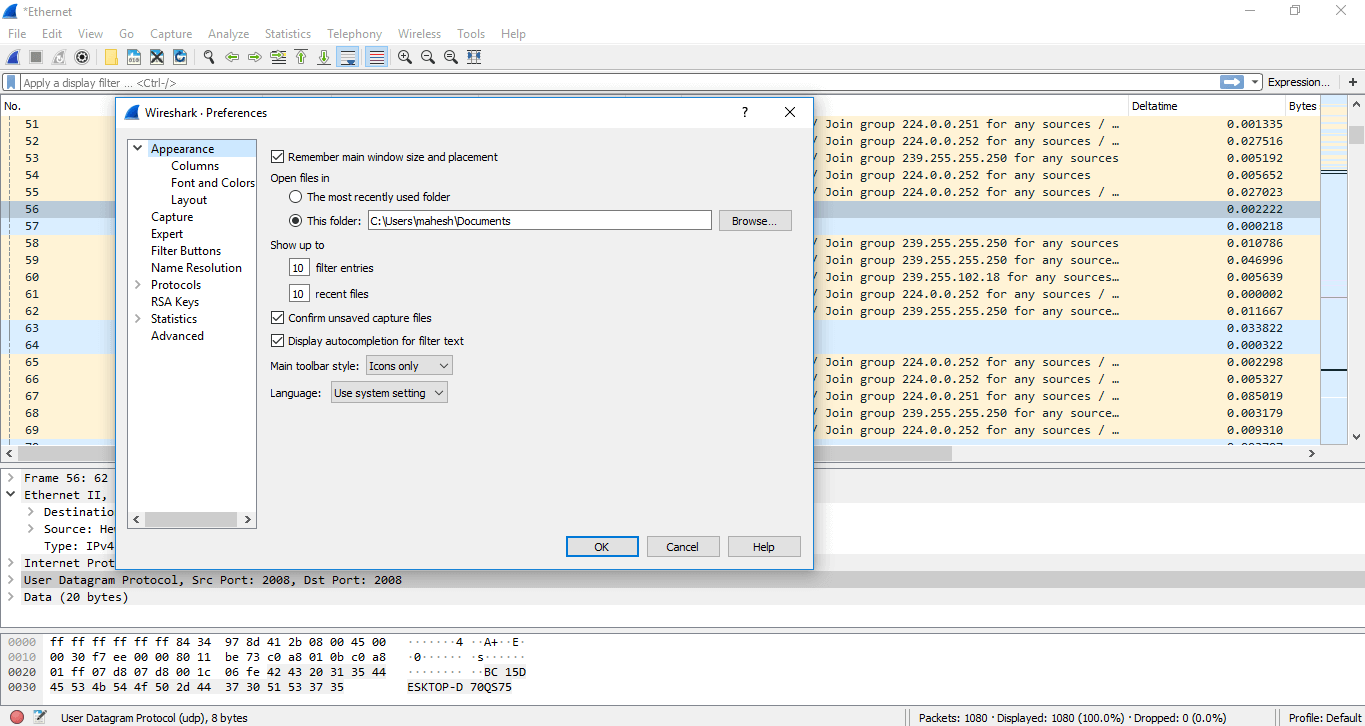
- Go to the ‘Edit’ option and select the ‘Preferences’ option.
- A dialogue will appear as shown below:
- Select the ‘Protocol’ option in the left column.
- From the drop-down list, select the ‘IEEE 802.11’ option. Check the box of decryption and click on the Edit option under it.
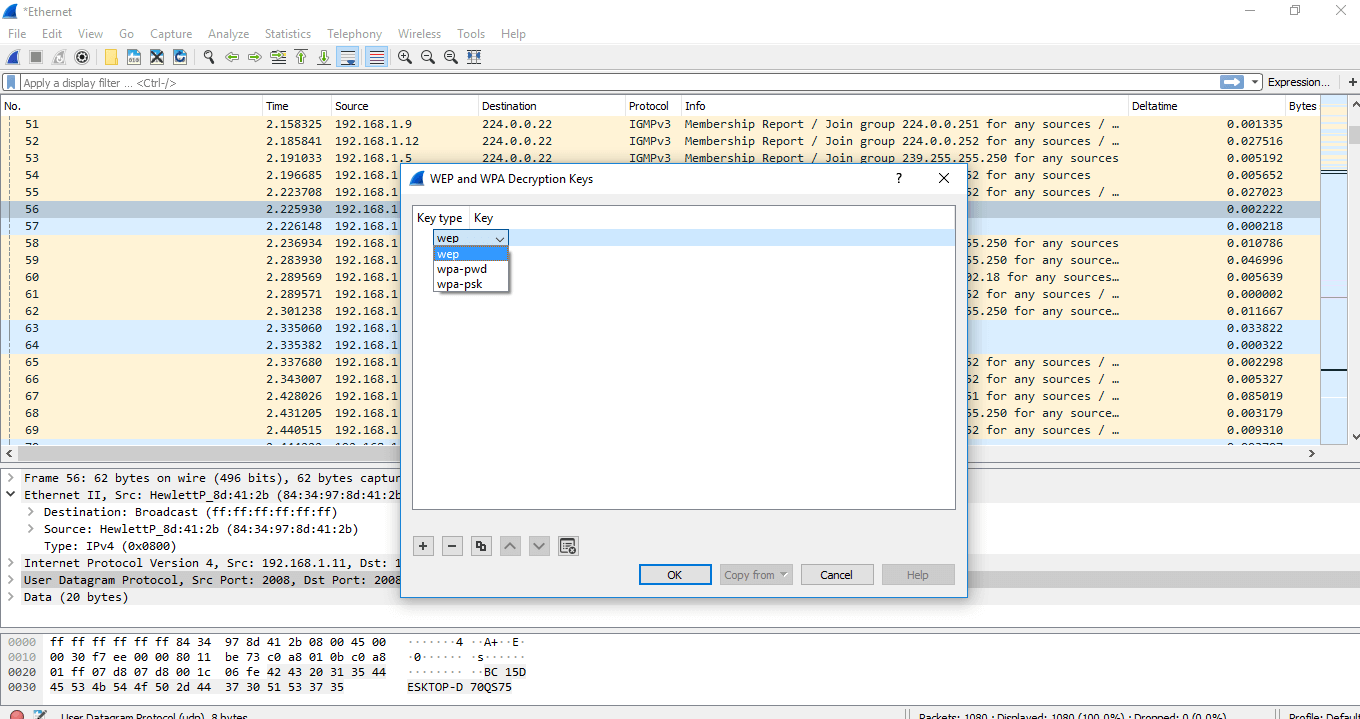
- A box will appear. Click on the option shown below:
- Select the option wpa-pwd and set the password accordingly.
- The data will be decrypted.
- But the above decryption process is only possible if there is a proper handshake.
The screen will then look as:
Below the captured packets, the data you see in the square brackets is the information that is not available in the packet itself. It is something that Wireshark displays for your benefit. If you want to add anything from this screen to the column area, you can right-click and select ‘Apply as column.’ That option will be added to the capture screen.
The most important is:
3 Way-Handshake
Y
Without three-way handshake, you cannot view the window scaling factor.
Some Facts about Wireshark:
TELEPHONY
The Telephony is the option on the menu bar. The image is shown below:
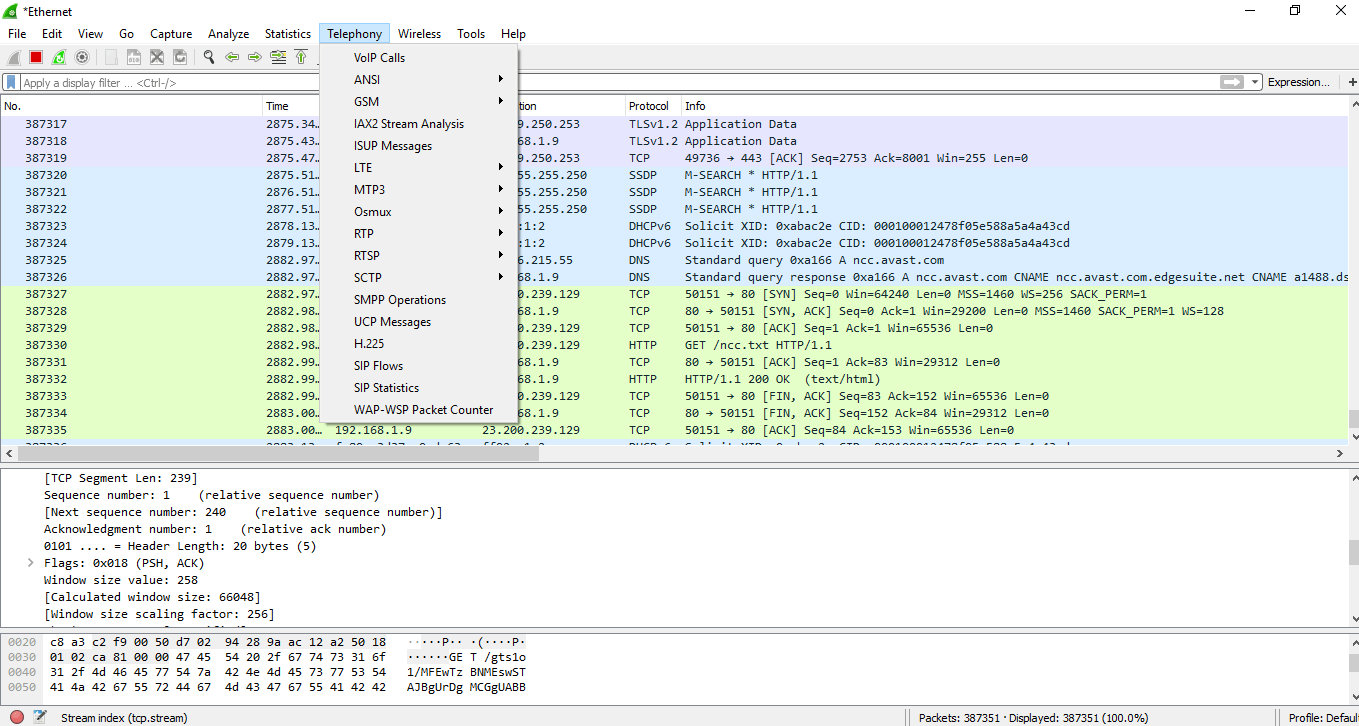
The options are explained below:
| VoIP calls | It stands for Voice over Internet Protocol. It gives the list of all the detected VoIP calls in the captured traffic. It shows the start time, stop time, initial speaker, protocol, duration, packet, state. |
| ANSI | It stands for American National Standards Institute. ANSI standards are developed by organizations who are authorized by it. |
| GSM | It stands for Global System for Mobile. It has various options. It has multiple options, which are used to view the messages count over the traffic. For this, you have to connect your phone to the computer through the USB-TTL converter, verify the layer. After you have to load layer 1 Firmware into the osmocon. Run mobile and specify the interface for sending GSM TAP to listen to the interface through Wireshark. |
| IAX2 Stream Analysis | It shows the graph with the forward and the reverse streams. |
| ISUP Messages | It stands for ISDN User Parts. It is used to establish and release calls between telephone exchanges. It shows the messages by count and direction. |
| LTE | It stands for Long Term Evolution. It uses RRC (Radio Resource Control) protocol, which controls MAC and RLC layers in the LTE interface. It shows the statistics of the captured LTE MAC and LTE RLC traffic. |
| MTP3 | It provides messaging routing between signaling points in the SS7 network. It shows its statistics and summary. It stands for Message Transfer Part. |
| Osmux | It is a multiplex protocol, which reduces the bandwidth by substituting the voice and signaling traffic. If it is not detected then Wireshark display this information of Osmux on UDP packets or flow. |
| RTP | It is called as RTP streams. It starts with the sequence number, packet number, and further stats are created based on the jitter, packet size, arrival time, and delay. It stands for Real-time Transport Protocol. |
| RTSP | It stands for Real-Time Streaming Protocol. It provides information about the packet counter of response packets and requests packets. |
| SCTP | It stands for Stream Control Transmission Protocol. It is designed to transmit PSTN signaling messages over IP networks. It is only applicable for broader applications. |
| SMPP Operations | It stands for Short Messages Peer to Peer. It determines the response, request, and operations of SMPP. |
| UCP Messages | It is used to determine whether the captured packet is UCP or Nacks. |
| H.225 | It is a streamed packetization and signaling protocol used for packet-based multimedia communication systems. |
| SIP Flows | It stands for Session Initiation Protocol. There is no need for any regular connection or multiples lines. Instead, it is installed on your current internet connection. It works with VoIP. |
| SIP Statistics | It gives information about the request methods and all of the SIP requests over a connection. |
| WAP-WSP Packet Counter | WSP stands for Wireless Session Protocol. It indicates the packets counts for all the Extended post methods, status codes, and PDU types. WAP uses short messages as a carrier. |
WIRESHARK DECRYPTION
The decryption process is used for the data to be in a readable format. Below are the steps for the decryption process.