Xamarin Profiler
The success of the application depends on the experiences of the End-user. As a developer, we might implement some excellent features in our app. But, if the app is full of crashes, then the user might want to get rid of this type of app. Developing mobile apps with Xamarin is easy, but it is not enough to develop a mobile app. To develop an excellent mobile app, it has to pass specific parameters. Apps should be user-friendly; UI should be perfect over all the devices and platforms. There should be proper memory management; all the exceptions should be handled. With Xamarin profiler, a developer can easily find the memory leaks, resolve the performance issue, exceptions. Xamarin profiler helps to know the application’s memory consumption. The parameters provided by the Xamarin profiler make the application perfect.
History
Historically, Mono has some powerful features like command-line Profiler, which gather information about the programs running in the Mono runtime called Monolog Profiler. The Xamarin Profiler is a graphical interface for the Monolog profiler which supports the Profiling of Android, iOS, and tvOS applications on windows.
Solution
Xamarin Profiler provides different options to measure the performance, which are:
- Allocation: It gives the data about memory. It gives us the data about memory allocation, Object Allocation, private bytes, and the call tree.
- Cycles: To track the memory cycles, we will get the cycle graph and the stack trace – this helps the developers to find the memory leaks.
- Time Profiler: Time Profiler is used to trace the performance of the application.
Download and Install
Xamarin Profiler is a standalone application, and it is integrated with Visual Studio for Mac. Here, we enable the Profiling within the IDE.
Download and Install the package for our platform
- macOS
- Windows
Download in Windows
To download the Xamarin Profiler click on this link: https://download.freedownloadmanager.org/Windows-PC/Xamarin-Profiler/FREE-1.5.5.0.html
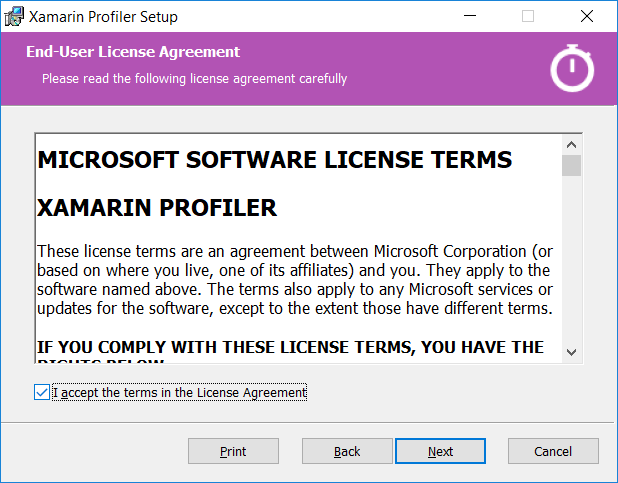
Check the radio button to accept the terms in the license agreement.
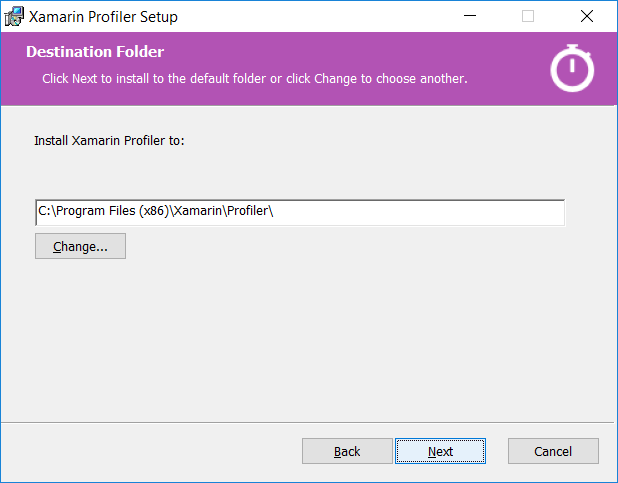
Choose the destination folder to install the Xamarin Profiler.
Click on Install, and it starts the installation.
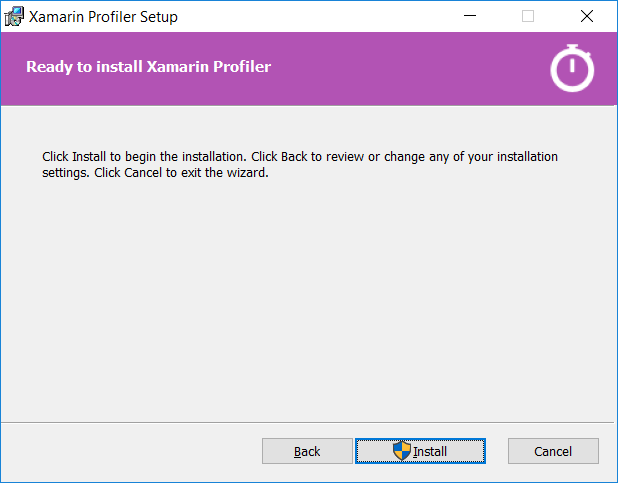
Installation is started :
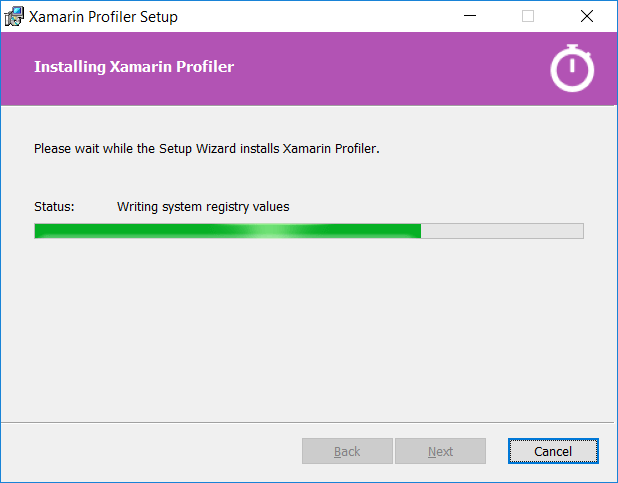
When downloaded, launch the installer to add the Xamarin Profiler to our system.
Profiler Support
The support for the Xamarin Profiler is available on the following platforms:
- Visual Studio for Mac(macOS with Enterprise Edition)
- Android
- Device, Emulator
- IOS
- Device and Simulator
- tVOS (Time instrument is not supported)
- Device and Simulator
- Mac
- Android
- Visual Studio (Enterprise Version)
- Android
- Device and Emulator
- iOS[Experimental]
- Device and Simulator
- tVOS
- Device and Simulator
- Android
Profiler Basics
Allow Profiling in our app
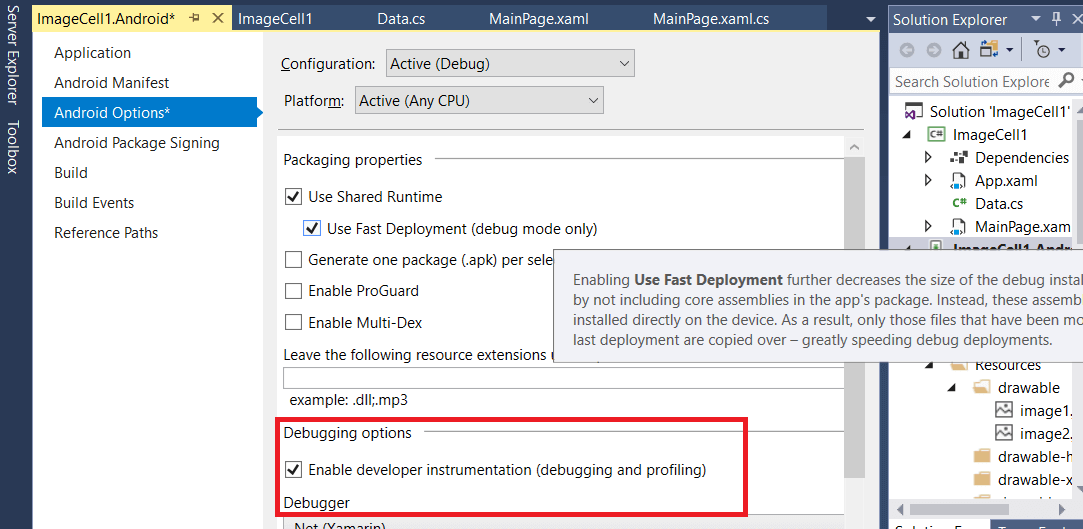
Before we successfully profile our app, we need to allow Profiling in the app’s project option.
For that, we have to follow these steps:
Build->Android Debug-> Enable Developer Instrumentation
Launching the Profiler
Xamarin Profiler can be launched from our IDE when we are profiling our Android or iOS application, or as a standalone application.
Launching from Visual Studio
- Firstly, we should have to make sure that the application is loaded in the Visual Studio and select the default debug configuration.
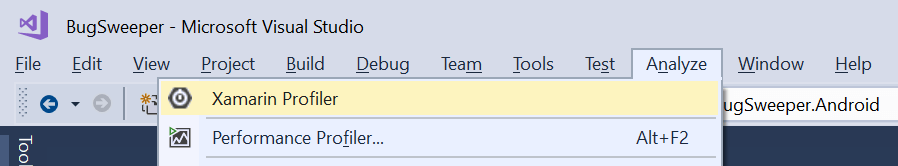
- Browse to Analyze-> Xamarin Profiler in Visual Studio, to open the Profiler as shown in the screenshot:
Visual Studio launches the Profiler and starts profiling the application automatically. The profiler can be used to measure memory and performance. Memory management can be achieved through the Allocation and Time Profiler instruments.
Saving and Loading of Profiler Sessions
To save the profiling session at any time, we have to choose the File-> SaveAs from the Profiler Menu bar. Profiler saves the file in .mlpd format. It is a highly compressed format for profiling the data.
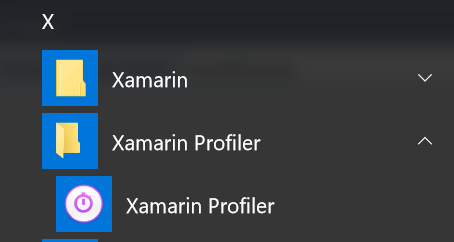
When the Xamarin Profiler application is installed, the application can be found in our application directory.
We can load .mlpd files into the Profiler by opening the standalone application. For that, we have to select Choose Target and load the data.
Profiler Features
Xamarin Profiler has five sections, as shown below:
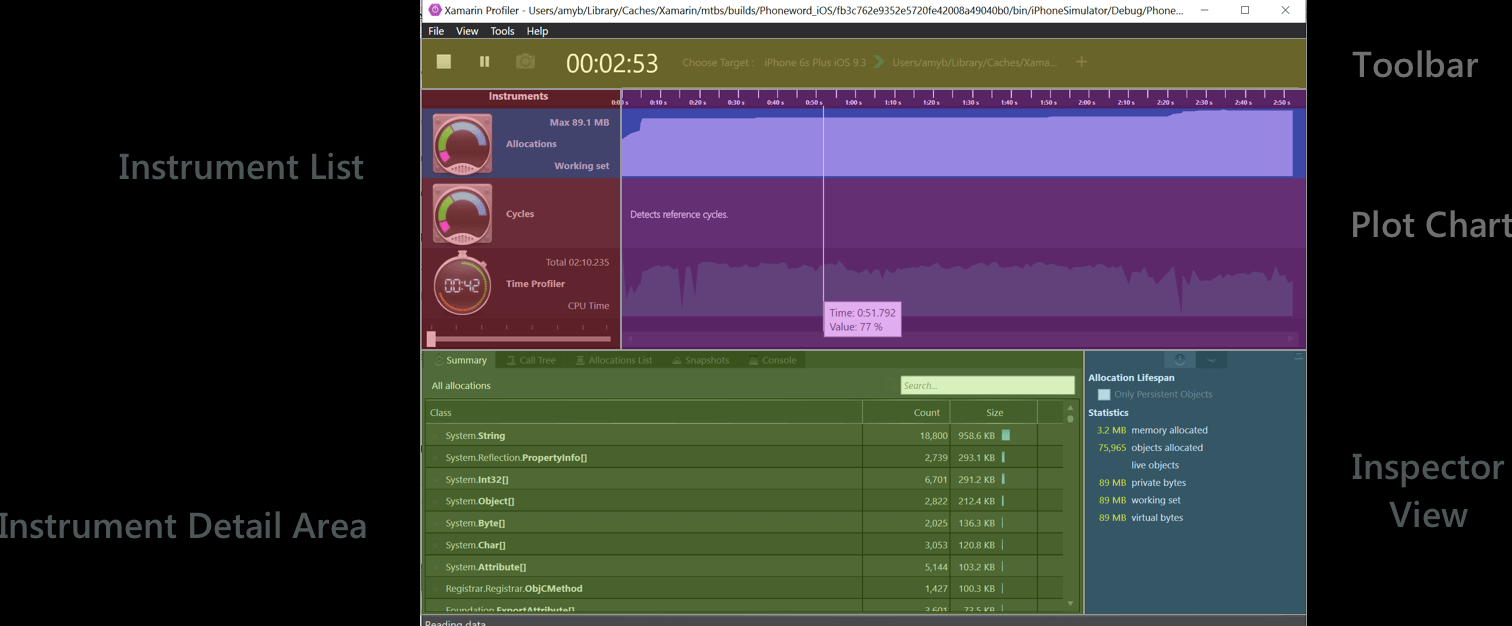
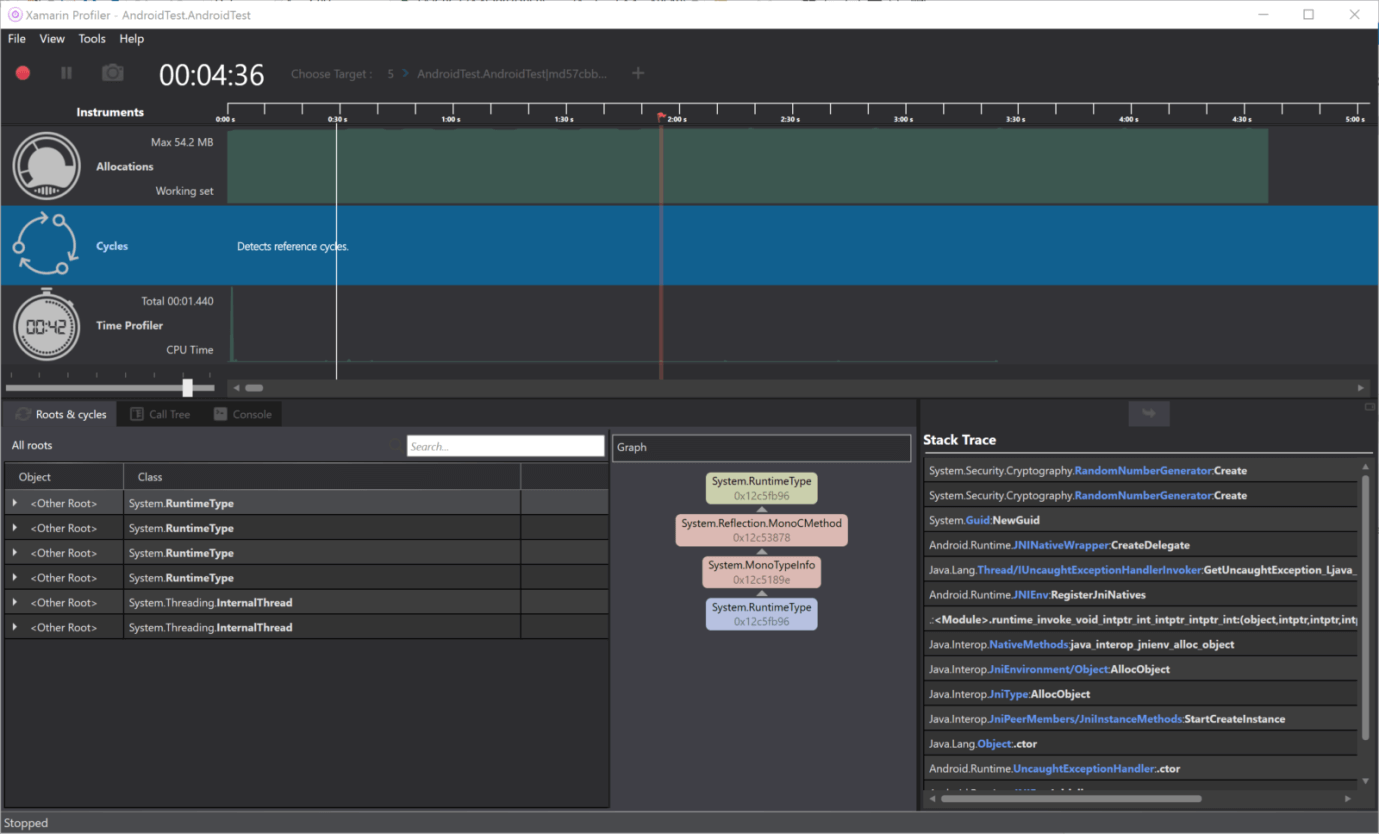
Toolbar: Toolbar located at the top of the Profiler, this shows the options to start and stop the Profiling. Here, we will select the target process, view the running time of the app, and will choose the split views that show the profiler application.
Instrument List: This shows the lists of all the loaded instruments for the profiling session.
Plot Chart: These charts are related horizontally to the relevant instruments in the instrument lists. A slider(position of Slider is below of the Time Profiler) can be used to change the scale.
Instrument Detail Area: This will show the data which is shown by the current instrument.
Inspector View: This shows the section that is selected by the segment control. This section is dependent on the chosen instrument, which includes: Configuration Setting, Statistics, Stack Trace information, and Path to roots.
Features of Profiler are:
Allocation: Allocation instrument provides information about the objects of the application, whether they are created or collection of garbage.
Allocation Chart will display at the top of the Profiler. Allocation chart shows the amount of memory allocation at the regular intervals during the Profiling. Currently, the allocation graph is the total number of the allocations, not the size of the heap at the point of the time. Allocation Chart will never go down, and it increases. Allocation Chart includes the allocation of the objects on the stack. Even for the same app, chart will look different, and it all depends on the runtime versions we are using.
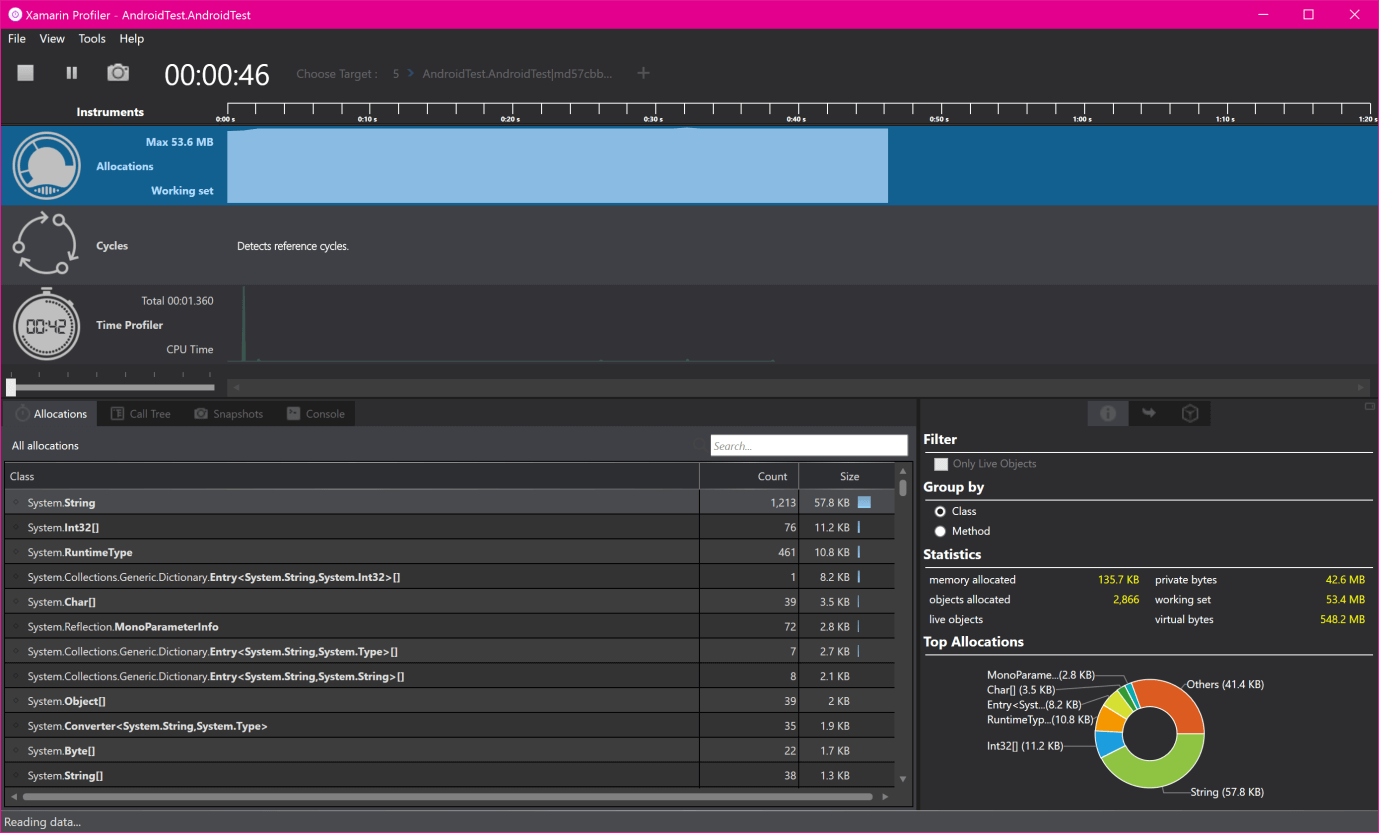
Allocation Chart shows the different views of the data in the Allocation instrument. Allocation Chart allows the developers to analyze how the application is using and freeing the memory.
Views are:
1. Allocations: Allocations display a list of all allocations and group them by class name. The allocation provides information about the classes and methods used, and the collective size of the classes that are used. Double-clicking on the class shows the memory allocation.
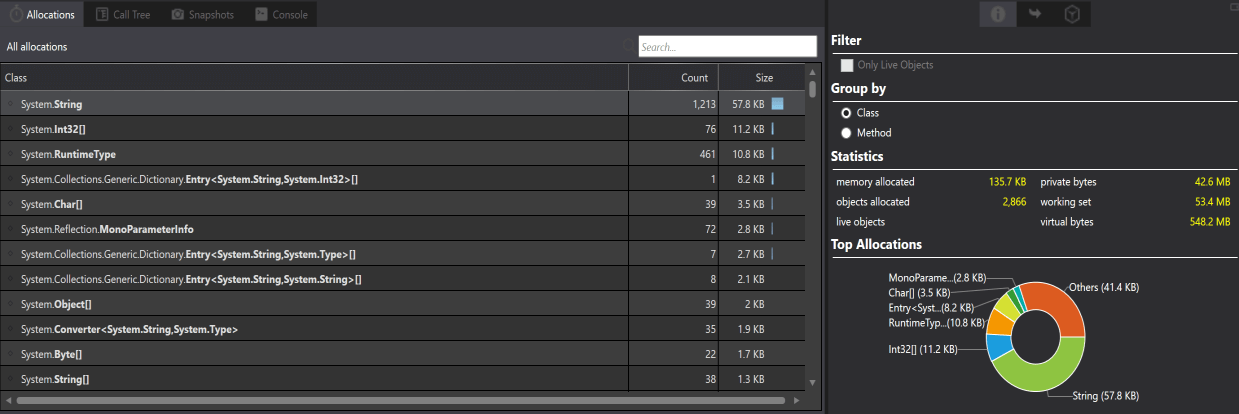
The inspector view of allocation provides the options for filtering and grouping the objects, provides the statistics on memory allocation as well as Stack Trace and Path to Root.
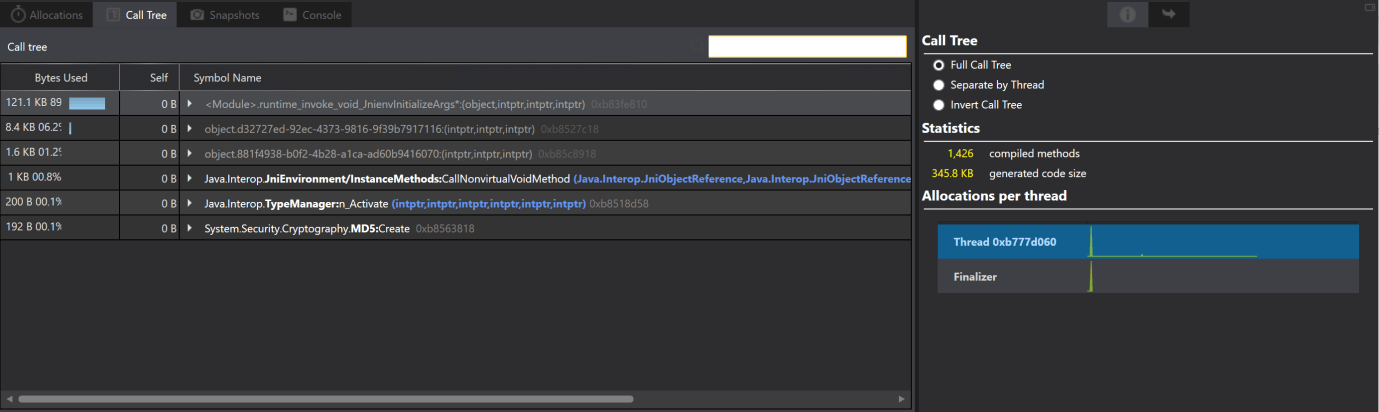
- Call Tree: This displays the entire call tree of all threads in the application and includes the information about the memory allocation on each node. When an element is selected in the list, all the sibling nodes appear grey. We can expand the Tree or double-click on the element to drill down into it. When we display the view of the data, the display setting, i.e., inspector view can be used to change the way it is presented. Call Tree includes the two options; they are:
- Inverted Call Tree: This consists of the stack trace from top to bottom. Inverted Call Tree is a convenient view option; it indicates the most profound method where the CPU spends its time.
- Separate by Thread: This option organizes the call tree by a thread.
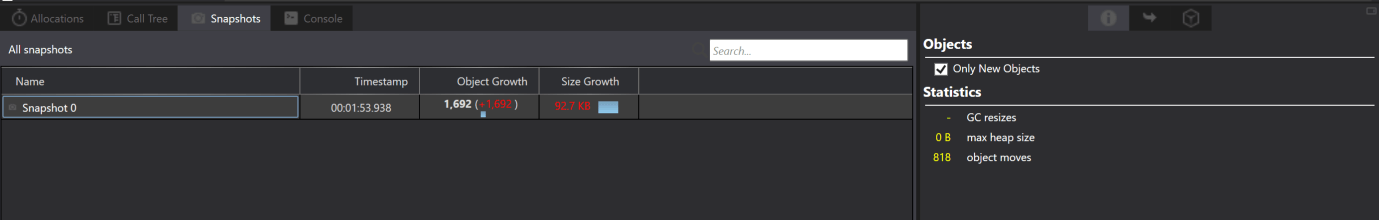
- Snapshots:This area shows information about memory snapshots. We can generate these when the Profiling of the application is live. For that, we have to click on the Camera button in the toolbar to capture all the points that we want to see how much memory is retained and released. We can then click each snapshot to explore what is happening under the hood.
Note: Here, we should have to notice that we can take snapshot only when the Profiling of the app is live.
2. Cycles: Through the use of C# and F# managed code. Through the use of C# code, it can be quite common and easy to create the reference of the objects, which will never be disposed of. This instrument allows us to pinpoint those objects and displays the referrals of the cycles in our application.
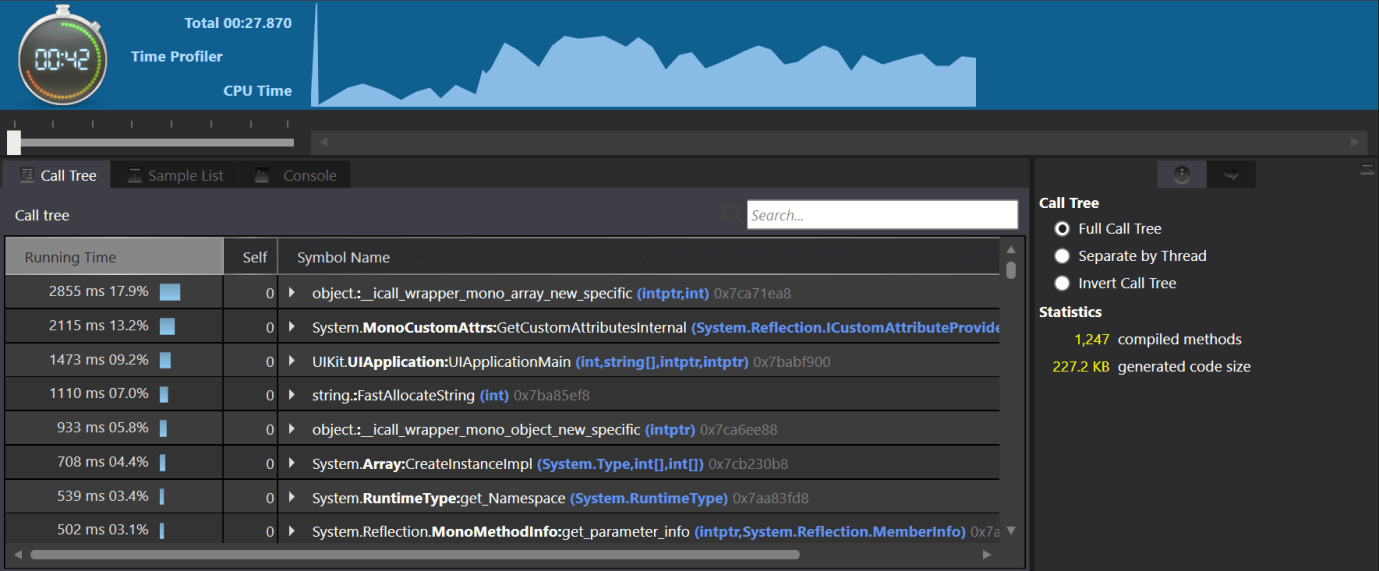
Time Profiler: Time Profiler instrument measures the spending time on each method of the application. Application is paused at regular intervals, and run stack trace on each active thread. Each row in the instrument detail area shows the execution path, which has been followed.
The below screenshot shows the number of samples received by the apps when it runs.
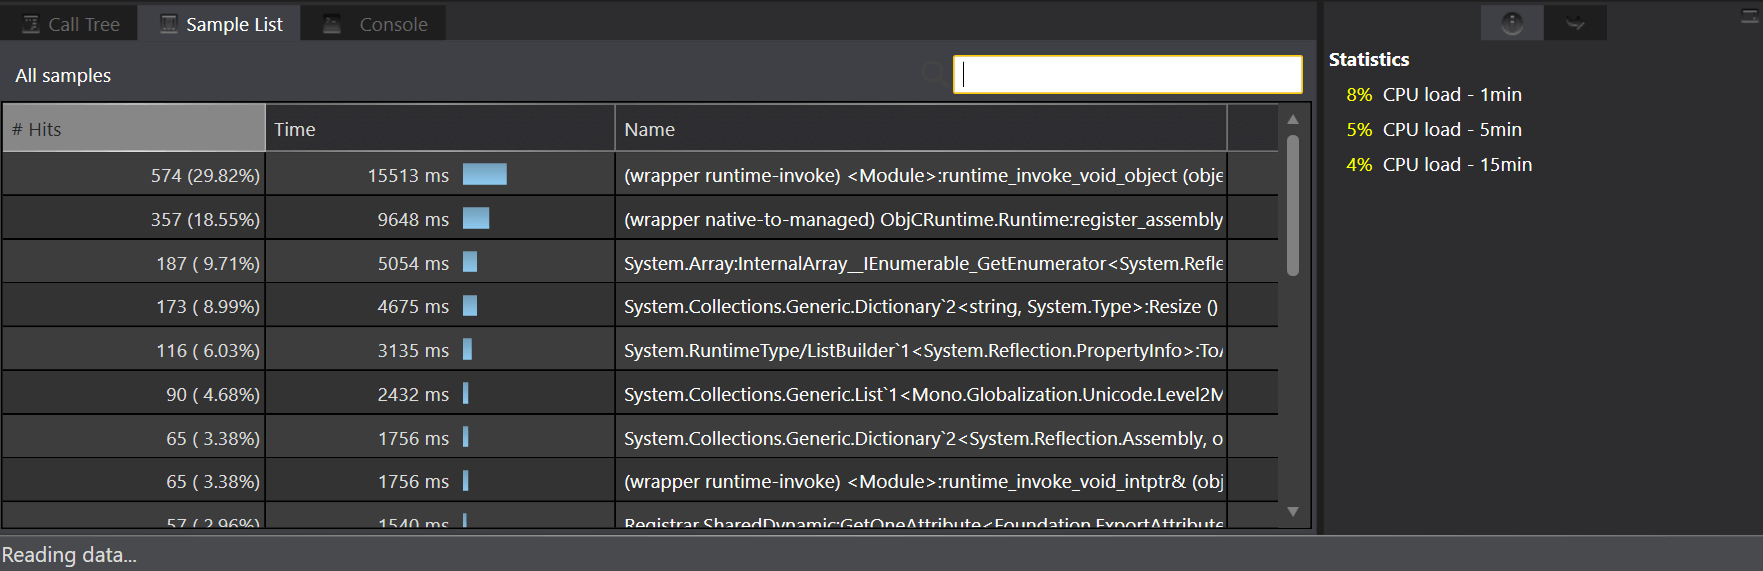
- Call Tree: Call Tree shows the amount of time spent in each method.