The term bivariate analysis refers to the analysis of two variables. You can remember this because the prefix “bi” means “two.”
The purpose of bivariate analysis is to understand the relationship between two variables. You can contrast this type of analysis with the following:
- Univariate Analysis: The analysis of one variable.
- Multivariate Analysis: The analysis of two or more variables.
There are three common ways to perform bivariate analysis:
1. Scatterplots.
2. Correlation Coefficients.
3. Simple Linear Regression.
This tutorial provides an example of each of these types of bivariate analysis using the following dataset that contains information about two variables: (1) Hours spent studying and (2) Exam score received by 20 different students:

1. Scatterplots
A scatterplot offers a visual way to perform bivariate analysis. It allows us to visualize the relationship between two variables by placing the value of one variable on the x-axis and the value of the other variable on the y-axis.
In the scatterplot below, we place hours studied on the x-axis and exam score on the y-axis:
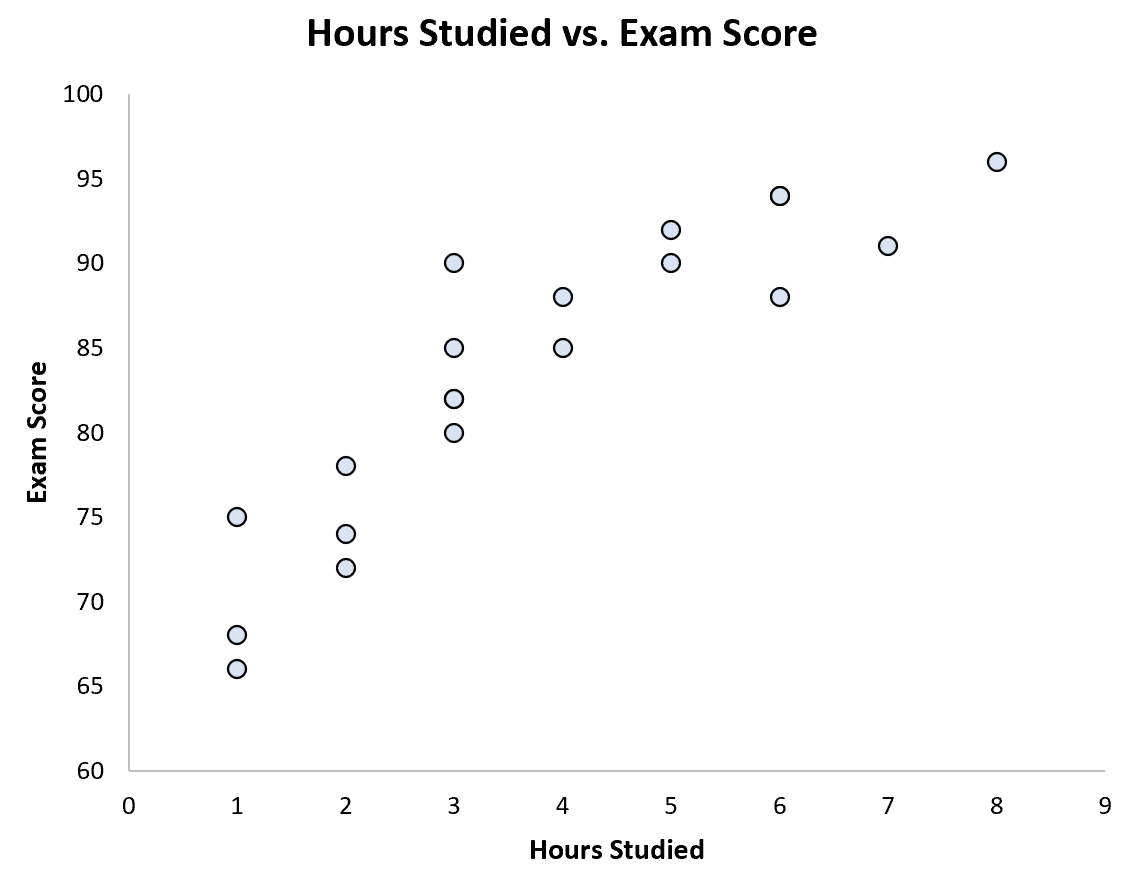
We can clearly see that there is a positive relationship between the two variables: As hours studied increases, exam score tends to increase as well.
2. Correlation Coefficients
A correlation coefficient offers another way to perform bivariate analysis. The most common type of correlation coefficient is the Pearson Correlation Coefficient, which is a measure of the linear association between two variables. It has a value between -1 and 1 where:
- -1 indicates a perfectly negative linear correlation between two variables
- 0 indicates no linear correlation between two variables
- 1 indicates a perfectly positive linear correlation between two variables
This simple metric gives us a good idea of how two variables are related. In practice, we often use scatterplots and correlation coefficients to understand the relationship between two variables so we can visualize and quantify their relationship.
3. Simple Linear Regression
A third way to perform bivariate analysis is with simple linear regression.
Using this method, we choose one variable to be an explanatory variable and the other variable to be a response variable. We then find the line that best “fits” the dataset, which we can then use to understand the exact relationship between the two variables.
For example, the line of best fit for the dataset above is:
Exam score = 69.07 + 3.85*(hours studied)
This means that each additional hour studied is associated with an average exam score increase of 3.85. By fitting this linear regression model, we can quantify the exact relationship between hours studied and exam score received.
Related: How to Perform Simple Linear Regression in Excel
Conclusion
Bivariate analysis is one of the most common types of analysis used in statistics because we’re often interested in understanding the relationship between two variables.
By using scatterplots, correlation coefficients, and simple linear regression, we can visualize and quantify the relationship between two variables.
Often these three methods are all used together in an analysis to gain a full picture of how two variables are related, so it’s a good idea to familiarize yourself with each method.