Data Selection in Data Mining
Data selection is defined as the process of determining the appropriate data type and source and suitable instruments to collect data. Data selection precedes the actual practice of data collection. This definition distinguishes data selection from selective data reporting (excluding data that is not supportive of a research hypothesis) and interactive/active data selection (using collected data for monitoring activities/events or conducting secondary data analyses). The process of selecting suitable data for a research project can impact data integrity.
The primary objective of data selection is determining appropriate data type, source, and instrument that allow investigators to answer research questions adequately. This determination is often discipline-specific and is primarily driven by the nature of the investigation, existing literature, and accessibility to necessary data sources.
Integrity issues can arise when the decisions to select ‘appropriate’ data to collect are based primarily on cost and convenience considerations rather than the ability of data to answer research questions adequately. Certainly, cost and convenience are valid factors in the decision-making process. However, researchers should assess to what degree these factors might compromise the integrity of the research endeavor.
Issues in Data Selection
There are some issues that researchers should be aware of when selecting data, such as:
- The appropriate type and sources of data permit investigators to answer the stated research questions adequately.
- Suitable procedures to obtain a representative sample.
- The proper instruments to collect data. It isn’t easy to disengage the selection of the type/source of data from instruments used to collect the data. There should be compatibility between the type/source of data and the mechanisms to collect it.
Types and Sources of Data
Data types and sources can be represented in a variety of ways. The two primary data types are:
- Quantitative represents as numerical figures – interval and ratio level measurements.
- Qualitative are text, images, audio/video, etc.
Although scientific disciplines differ in their preference for one type over another, some investigators utilize information from both quantitative and qualitative with the expectation of developing a richer understanding of a targeted phenomenon.
Researchers collect information from human beings that can be qualitative (ex. observing child-rearing practices) or quantitative (recording biochemical markers, anthropometric measurements). Data sources can include field notes, journals, laboratory notes/specimens, or direct observations of humans, animals, plants. Interactions between data type and source are not infrequent.
Determining appropriate data is discipline-specific and is primarily driven by the nature of the investigation, existing literature, and accessibility to data sources. Questions that need to know when selecting data type and sources are given below:
- What is the research question?
- What is the scope of the investigation? (This defines the parameters of any study. Selected data should not extend beyond the scope of the study).
- What has the literature (previous research) determined to be the most appropriate data to collect?
- What type of data should be considered: quantitative, qualitative, or a composite of both?
What is Feature Selection in Data Mining?
Feature selection has been an active research area in pattern recognition, statistics, and data mining communities. The main idea of feature selection is to choose a subset of input variables by eliminating features with little or no predictive information. Feature selection can significantly improve the comprehensibility of the resulting classifier models and often build a model that generalizes better to unseen points. Further, it is often the case that finding the correct subset of predictive features is an important problem in its own right.
For example, a physician may decide based on the selected features whether a dangerous surgery is necessary for treatment or not. Feature selection in supervised learning has been well studied, where the main goal is to find a feature subset that produces higher classification accuracy.
Recently, several researchers have studied feature selection and clustering together with a single or unified criterion. For feature selection in unsupervised learning, learning algorithms are designed to find a natural grouping of the examples in the feature space. Thus feature selection in unsupervised learning aims to find a good subset of features that forms the high quality of clusters for a given number of clusters.
However, the traditional approaches to feature selection with a single evaluation criterion have shown limited capability in terms of knowledge discovery and decision support. This is because decision-makers should take into account multiple, conflicting objectives simultaneously. In particular, no single criterion for unsupervised feature selection is best for every application, and only the decision-maker can determine the relative weights of criteria for her application.
Why Do Feature Selection?
Feature selection is critical to building a good model for several reasons. One is that feature selection implies some degree of cardinality reduction to impose a cutoff on the number of attributes that can be considered when building a model. Data almost always contain more information than is needed to build the model or the wrong kind of information. For example, you might have a dataset with 500 columns that describe the characteristics of customers; however, if the data in some of the columns are very sparse, you would gain very little benefit from adding them to the model, and if some of the columns duplicate each other, using both columns could affect the model.
Not only does feature selection improve the quality of the model, but it also makes the process of modeling more efficient. Using unneeded columns while building a model requires more CPU and memory during the training process, and more storage space is required for the completed model. Even if resources were not an issue, you would still want to perform feature selection and identify the best columns because unneeded columns can degrade the quality of the model in several ways:
- Noisy or redundant data makes it more difficult to discover meaningful patterns.
- Most data mining algorithms require a much larger training data set if the data set is high-dimensional.
During the process of feature selection, either the analyst or the modeling tool or algorithm actively selects or discards attributes based on their usefulness for analysis. The analyst might perform feature engineering to add features and remove or modify existing data, while the machine learning algorithm typically scores columns and validates their usefulness in the model.
In short, feature selection helps solve two problems: having too much data of little value or too little data of high value. Your goal in feature selection should be to identify the minimum number of columns from the data source that is significant in building a model.
How Feature Selection Works in SQL Server
Feature selection is always performed before the model is trained. With some algorithms, feature selection techniques are “built-in” to exclude irrelevant columns, and the best features are automatically discovered. Each algorithm has its own set of default techniques for intelligently applying feature reduction. However, you can also manually set parameters to influence feature selection behavior.
A score is calculated for each attribute during automatic feature selection, and only the attributes with the best scores are selected for the model. SQL Server Data Mining provides multiple methods for calculating these scores. The exact method applied in any model depends on the following factors: You can also adjust the threshold for the top scores.
- The algorithm used in your model
- The data type of the attribute
- Any parameters that you may have set on your model
Feature selection is applied to inputs, predictable attributes, or states in a column. When scoring for feature selection is complete, only the attributes and states that the algorithm selects are included in the model-building process and can be used for prediction. If you choose a predictable attribute that does not meet the threshold for feature selection, the attribute can still be used for prediction. Still, the predictions will be based solely on the global statistics in the model.
NOTE: Feature selection affects only the columns used in the model and does not affect the storage of the mining structure. The columns that you leave out of the mining model are still available in the structure, and data in the mining structure columns will be cached.
Feature Selection Scores
SQL Server Data Mining supports these popular and well-established methods for scoring attributes. The specific method used in any particular algorithm or data set depends on the data types and the column usage.
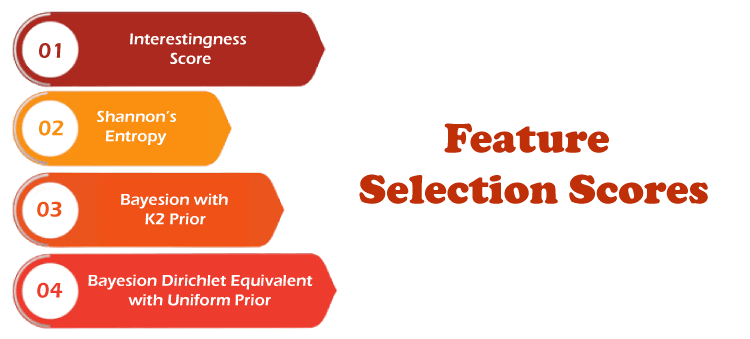
1. Interestingness score
The interestingness score is used to rank and sort attributes in columns that contain non-binary continuous numeric data. However, interestingness can be measured in many ways. The novelty might be valuable for outlier detection, but the ability to discriminate between closely related items or weight might be more interesting for classification.
The measure of interestingness that is used in SQL Server Data Mining is entropy-based, meaning that attributes with random distributions have higher entropy and lower information gain. Therefore, such attributes are less interesting. The entropy for any particular attribute is compared to the entropy of all other attributes, as follows:
Central entropy, or m, means the entropy of the entire feature set. By subtracting the entropy of the target attribute from the central entropy, you can assess how much information the attribute provides.
2. Shannon’s Entropy
Shannon’s entropy measures the uncertainty of a random variable for a particular outcome. For example, the entropy of a coin toss can be represented as a function of the probability of it coming up heads. Analysis Services uses the following formula to calculate Shannon’s entropy:
This scoring method is available for discrete and discretized attributes.
3. Bayesian with K2 Prior
SQL Server Data Mining provides two feature selection scores based on Bayesian networks. A Bayesian network is a directed or acyclic graph of states and transitions between states, meaning that some states are always before the current state, some states are posterior, and the graph does not repeat or loop. By definition, Bayesian networks allow the use of prior knowledge. However, the question of which prior states to use in calculating probabilities of later states is important for algorithm design, performance, and accuracy.
The K2 algorithm for learning from a Bayesian network was developed by Cooper and Herskovits and is often used in data mining. It is scalable and can analyze multiple variables but requires ordering on variables used as input. This scoring method is available for discrete and discretized attributes.
4. Bayesian Dirichlet Equivalent with Uniform Prior
The Bayesian Dirichlet Equivalent (BDE) score also uses Bayesian analysis to evaluate a network given a dataset. The Dirichlet distribution is a multinomial distribution that describes the conditional probability of each variable in the network and has many properties that are useful for learning.
The BDE scoring method was developed by Heckerman and is based on the BD metric developed by Cooper and Herskovits.
A mathematical constant is used to create a fixed or uniform distribution of prior states. The Bayesian Dirichlet Equivalent with Uniform Prior (BDEU) method assumes a special case of the Dirichlet distribution. The BDE score also assumes likelihood equivalence, which means that the data cannot be expected to discriminate equivalent structures. In other words, if the score for If A Then B is the same as the score for If B Then A, the structures cannot be distinguished based on the data, and causation cannot be inferred.
Feature Selection Parameters
You can control when feature selection is turned on by using the following parameters in algorithms that support feature selection. Each algorithm has a default value for the number of allowed inputs, but you can override this default and specify the number of attributes. This section lists the parameters that are provided for managing feature selection.
- MAXIMUM_INPUT_ATTRIBUTES
If a model contains more columns than the number that is specified in the MAXIMUM_INPUT_ATTRIBUTES parameter, the algorithm ignores any columns that it calculates to be uninteresting. - MAXIMUM_OUTPUT_ATTRIBUTES
Similarly, if a model contains more predictable columns than the number that is specified in the MAXIMUM_OUTPUT_ATTRIBUTES parameter, the algorithm ignores any columns that it calculates to be uninteresting. - MAXIMUM_STATES
If a model contains more cases than are specified in the MAXIMUM_STATES parameter, the least popular states are grouped together and treated as missing. If any of these parameters are set to 0, feature selection is turned off, affecting processing time and performance. In addition to these methods for feature selection, you can improve the algorithm’s ability to identify or promote meaningful attributes by setting modeling flags on the model or by setting distribution flags on the structure.