IntelliJ IDEA Code Inspection
Inspection is a static code analysis tool which helps us to find runtime errors, locate dead code, detect performance issue, memory leak, spelling problems and also improve the overall code structure. It does not only tell us about where is the problem in the code but also suggest the corrections right away. Code Inspection are available when we perform code analysis for –
- The Whole Project
- Particular File
- Custom Scope
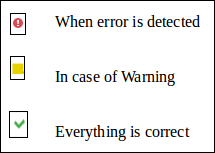
By default, IntelliJ IDEA performs analysis on all open files. If an error is detected in the project then we will see the following icon in the top right side of the Editor –
Running Code Inspections
There are two ways to run Code Inspection –
1. Inspect Code
- Open the file in the Editor.
- Go to Analyse -> Inspect Code.
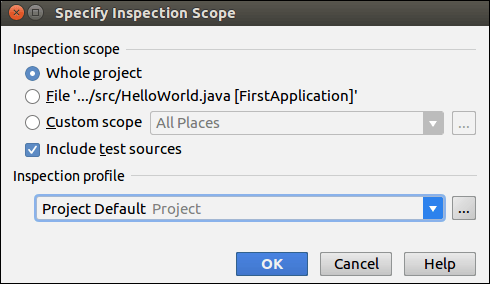
- Dialog Box Open. Select one of the following –
- The Whole Projects
- Particular File
- Custom Scope
- Specify the Inspection Profile
- Click Ok button.
2. Run Inspection by Name
- Open the file in the Editor.
- Go to Analyse -> Run Inspection By Name.
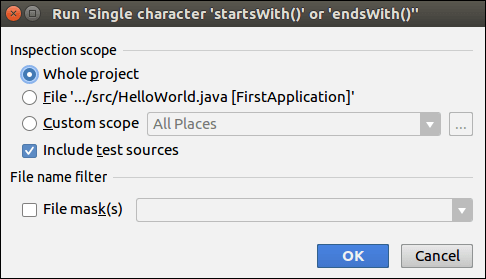
- Dialog Box open. Enter the Inspection Name
- New Window will open. Select one of the following –
- The Whole Projects
- Particular File
- Custom Scope
- Select the Include test sources checkbox.
- Select the File Masks, if we want to apply Inspection only in that files which have matching the specific Masks. Click Ok.
Inspection Profile
During Code Inspection, we can also tell IntelliJ IDEA about the type of problems we would like to search for and get reports about them. This action can be performed by the Inspection Profile. Inspection Profile can be applicable for both: the entire IDE or only for the specific project.