IntelliJ IDEA Debugging
Debugging suggests to deal with the bugs. It allows us to trace the running code, inspect the state of code and the flow of execution. The IntelliJ IDEA debugger helps us to easily debug anything from the simplest code to the complex application. Using IntelliJ debugger, we can do the following steps- stop the execution of a program at any point, step into function, Line breakpoints, Inspect variables, Evaluate an expression and so on. Some of the Java in-built debuggers are:
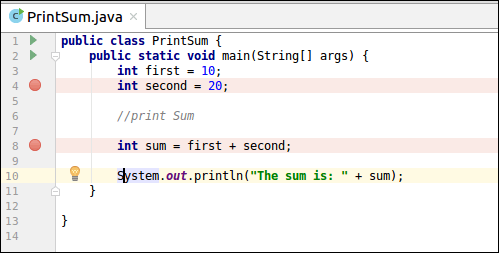
Breakpoints
It allows us to stop the program at certain points. They are triggered when the program reaches the specified line of source code before it is executed. The breakpoint marked with a red stripe, and once the line of code is reached, it changes to blue. IntelliJ IDEA supports following types of Breakpoints –
Line Breakpoints, Exception Breakpoints, Method Breakpoints etc. In the below screenshots, Red circle symbol denotes the breakpoints which are in line no. 4 and line no. 8.
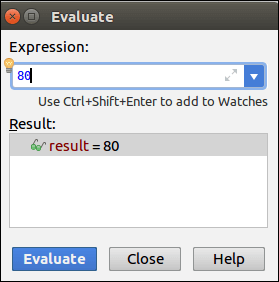
Evaluate Expression
Follow the steps given below to evaluate expression:
- Start application in debugger.
- Go to Run->Evaluate Expression. Dialog box open.
Step Into
During debugging, if a method is found and we select its step into action then debugger will stop program execution at each point of that method. To do step into action, do the following:
- Start application in debugging mode.
- Go to Run->Step into.
Step Out
It is the reverse action of Step into action. It starts execution from the next line of the step into action. To do step into action do the following:
- Start application in debugging mode.
- Go to Run->Step out.
Resume Program
This action will continue the execution of program by ignoring all breakpoints in the program.
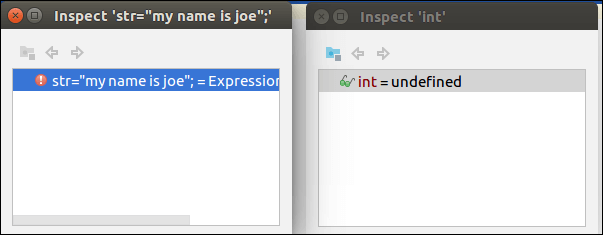
Inspecting variables
IntelliJ IDEA provides supports to inspect any variable in its own window. For Example, if we want to examine several references in the context of the current frame and want to view all of them simultaneously then we can do this by inspection window. It helps to view the values of variable information not only in the Editor window, but it can also view in the debug window. We can launch as many as inspection windows required. To open Inspection window, do the following:
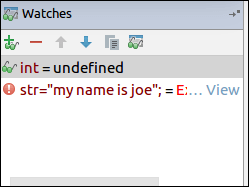
- Open the Watches pane
- Type the variable in Watches pane which we want to open in the Inspection Window.
- Now, select variable, right click on it. A context menu open, choose Inspect. Below screen will appear.