R-squared, often written as r2, is a measure of how well a linear regression model fits a dataset.
In technical terms, it is the proportion of the variance in the response variable that can be explained by the predictor variable.
The value for r2 can range from 0 to 1:
- A value of 0 indicates that the response variable cannot be explained by the predictor variable at all.
- A value of 1 indicates that the response variable can be perfectly explained without error by the predictor variable.
The following example shows how to calculate R-squared for two variables in Google Sheets.
Example: Calculating R-Squared in Google Sheets
Suppose we have the following data for the number of hours studied and the exam score received for 20 students:

Now suppose we want to fit a simple linear regression model, using “hours” as the predictor variable and “score” as the response variable.
To find the R-squared for this model, we can use the RSQ() function in Google Sheets, which uses the following syntax:
=RSQ(known_ys, known_xs)
where:
- known_ys: the values for the response variable
- known_xs: the values for the predictor variable
In our example, we can type the following formula into cell D2:
=RSQ(A2:A21, B2:B21)
The following screenshot shows how to use this formula in practice:
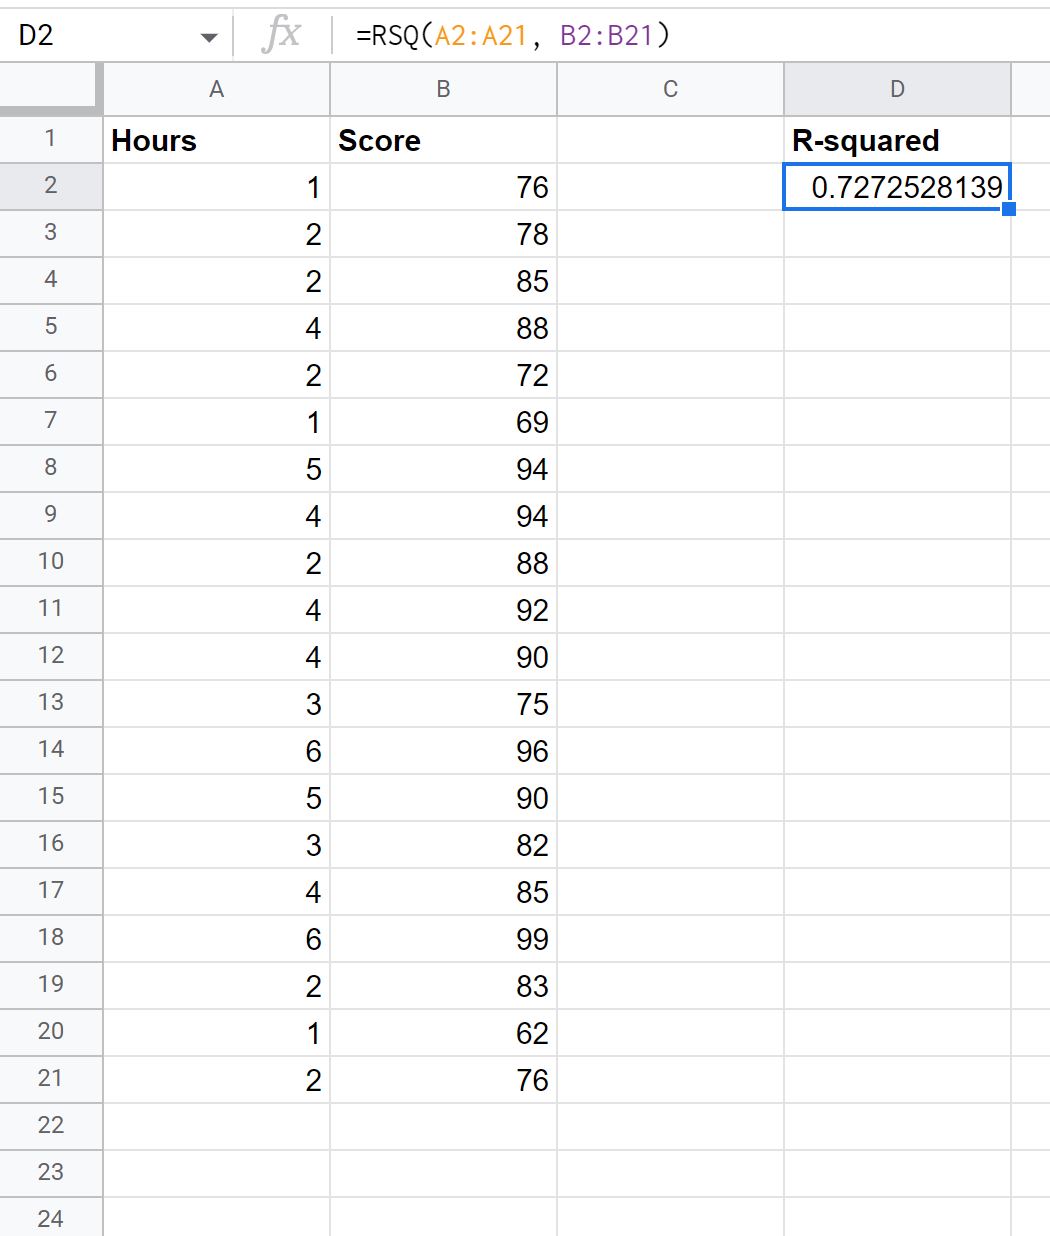
The R-squared value turns out to be about 0.7273.
This means that 72.73% of the variation in the exam scores can be explained by the number of hours studied.
Related: What is a Good R-squared Value?
Additional Resources
The following tutorials explain how to perform other common tasks in Google Sheets:
How to Find A Line of Best Fit in Google Sheets
How to Perform Linear Regression in Google Sheets
How to Create a Forecast in Google Sheets (With Example)