When creating a boxplot in seaborn, you can use the argument showfliers=False to remove outlier observations from the plot:
sns.boxplot(x='variable', y='value', data=df, showfliers=False)
If you’d like to simply change the size of the outlier markers, you can use the fliersize argument:
sns.boxplot(x='variable', y='value', data=df, fliersize=3)
Note that the default size for fliersize is 5.
The following example shows how to use these arguments in practice.
Example: Remove Outliers from Seaborn Boxplot
Suppose we have the following pandas DataFrame that shows the points scored by players on three different basketball teams:
import pandas as pd

#create DataFrame
df = pd.DataFrame({'A': [5, 7, 7, 9, 12, 78],
                   'B': [8, 8, 9, 13, 15, 17],
                   'C': [1, 2, 2, 4, 5, 60]})

#melt data frame into long format
df_melted = pd.melt(df)

#view head of DataFrame
print(df_melted.head())

  variable  value
0        A      5
1        A      7
2        A      7
3        A     19
4        A     22
We can use the following syntax to create three boxplots that show the distribution of points scored by each team:
import seaborn as sns

#create boxplot to visualize distribution of points by team
sns.boxplot(x='variable', y='value', data=df_melted) 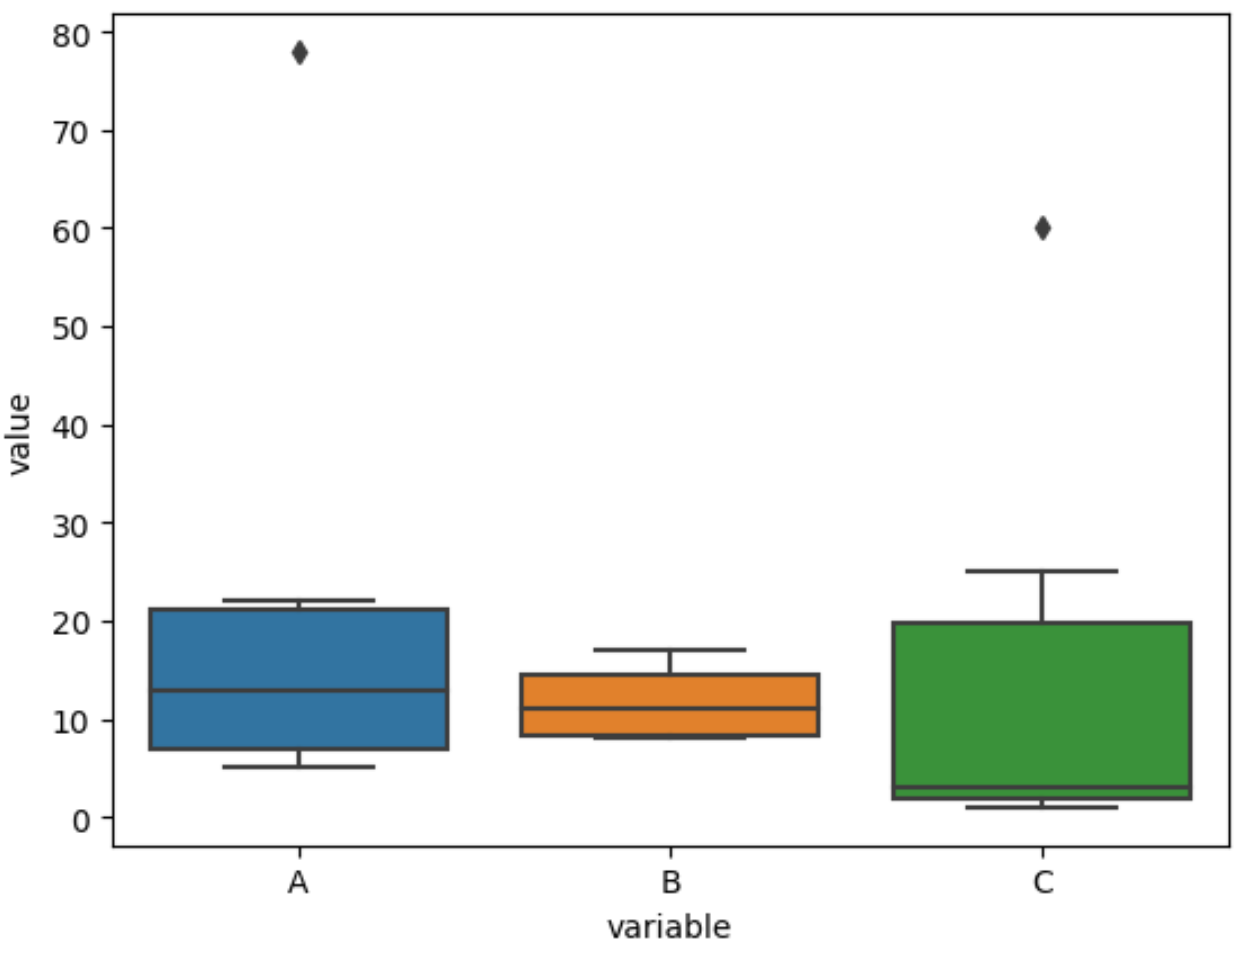
By default, seaborn uses diamond-shaped markers to display outlier observations.
To remove these outliers from the plot, we can use the argument showfliers=False:
import seaborn as sns

#create boxplots and remove outliers
sns.boxplot(x='variable', y='value', data=df_melted, showfliers=False) 
Notice that the outliers have been removed from the plot entirely.
To simply change the marker size of the outliers, we can use the fliersize argument:
import seaborn as sns

#create boxplots and adjust markers for outliers to be smaller
sns.boxplot(x='variable', y='value', data=df_melted, fliersize=3) 
Notice that the marker sizes for the outliers are much smaller.
Feel free to adjust the value for the fliersize to make the marker size as small or large as you’d like.
Note: You can find the complete documentation for the seaborn.boxplot() function here.
Additional Resources
The following tutorials explain how to create other common visualizations in seaborn:
How to Create a Pie Chart in Seaborn
How to Create an Area Chart in Seaborn
How to Create a Time Series Plot in Seaborn