Countplot in Python
In this article, we will discuss how we can create a countplot using the seaborn library and how the different parameters can be used to infer results from the features of our dataset.
Seaborn library
The seaborn library is widely used among data analysts, the galaxy of plots it contains provides the best possible representation of our data.
The seaborn library can be imported into our working environment using-
Let us now discuss why do we use countplot and what is the significance of its parameters.
Countplot
The countplot is used to represent the occurrence(counts) of the observation present in the categorical variable.
It uses the concept of a bar chart for the visual depiction.
Parameters-
The following parameters are specified when we create a countplot, let us get a brief idea of them-
- x and y- This parameter specifies the data we refer to for representation and then observes the highlighted patterns.
- color- This parameter specifies the color that can give a good appearance to our plot.
- palette- It takes the value of the palette. It is mostly used to show the hue variable.
- hue- This parameter specifies the column name.
- data- This parameter specifies the data frame we would like to take for the representation. For instance, data can be an array.
- dodge- This parameter is an optional one and it accepts a Boolean value as input.
- saturation- This parameter accepts a float value. A variation in the intensity of colors can be observed when we specify this.
- hue_order- The parameter hue_order takes strings as an input.
- kwargs- The parameter kwargs specifies the key and value mappings.
- ax- The parameter ax is an optional one and is used to take axes on which plots are created.
- orient- The parameter orient is an optional one and tells the orientation of the plot that we need, horizontal or vertical.
Now let us see what are the different ways of representing our attributes.
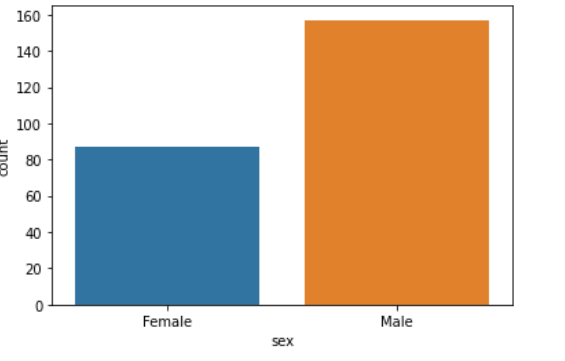
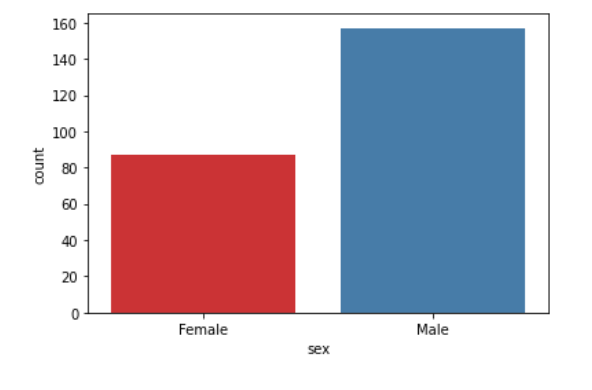
In the first example, we will create a countplot for a single variable. We have taken the dataset ‘tips’ to implement the same.
1. Value counts for a single variable
Example –
Output:
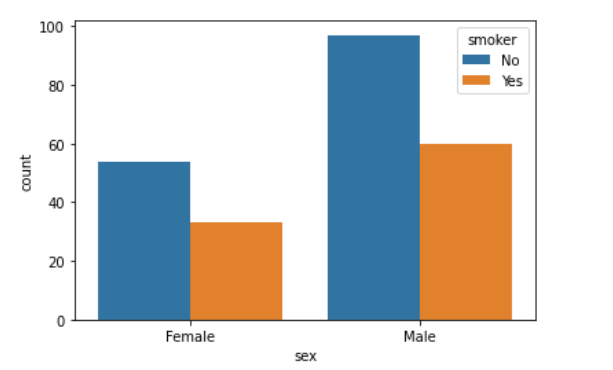
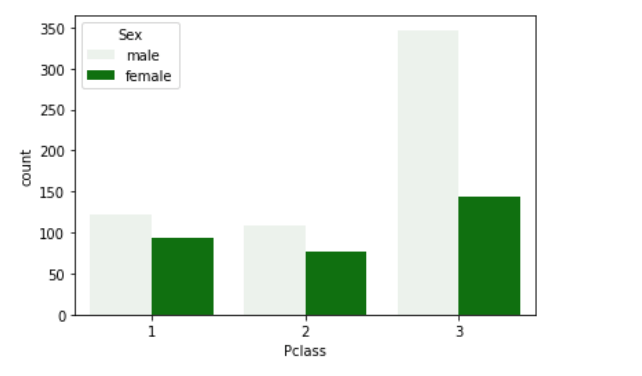
In the next example, we will use the hue parameter and create a countplot.
The following program illustrates the same-
2. Representing two categorical variables using hue parameter
Example –
Output:
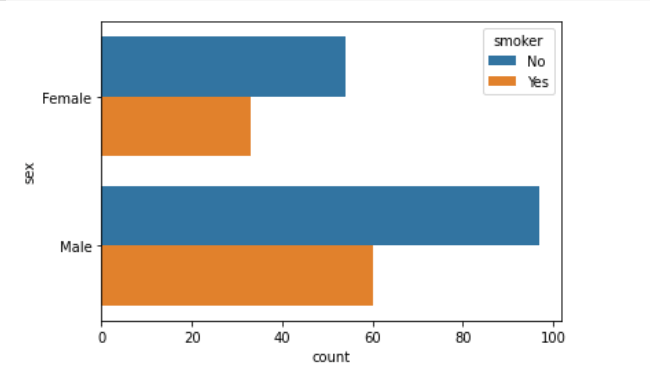
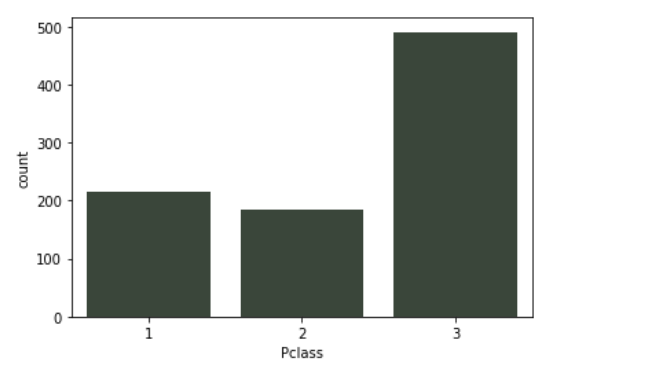
In the next example, we will consider the y axis and create a horizontal countplot.
The following program illustrates the same-
3. Creating Horizontal Plots
Example –
Output:
Let us now have a look at how color palettes can enhance the presentation of our data.
In the next example, we will use the parameter “palette”.
The following program illustrates the same-
4. Using color palettes
Input-
Output:
In the next example, we will use the parameter color and let us see how does it works?
The following program illustrates the same-
5. Using a parameter ‘color’
Example –
Output:
Now we will use the parameter ‘saturation’ and see how does it impact the representation of our data.
The following program illustrates the same-
6. Using the parameter ‘saturation’
Example –
Output:
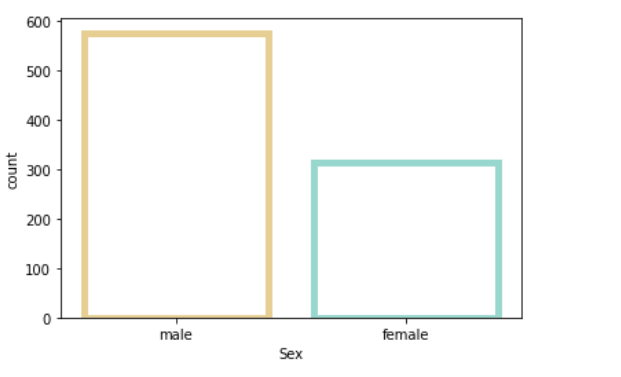
And finally in the last example we will use the parameters linewidth and edgecolor.
- Using matplotlib.axes.Axes.bar()
Example –
Output: