In statistics, we’re often interested in understanding the relationship between two variables.
For example, we might want to understand the relationship between the number of hours a student studies and the exam score they receive.
One way to quantify this relationship is to use the Pearson correlation coefficient, which is a measure of the linear association between two variables. It has a value between -1 and 1 where:
- -1 indicates a perfectly negative linear correlation between two variables
- 0 indicates no linear correlation between two variables
- 1 indicates a perfectly positive linear correlation between two variables
The further away the correlation coefficient is from zero, the stronger the relationship between the two variables.
Related: What is Considered to Be a “Strong” Correlation?
But in some cases we want to understand the correlation between more than just one pair of variables. In these cases, we can create a correlation matrix, which is a square table that shows the the correlation coefficients between several variables.
Example of a Correlation Matrix
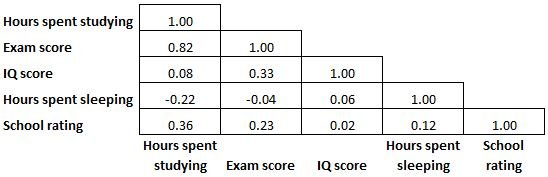
The correlation matrix below shows the correlation coefficients between several variables related to education:
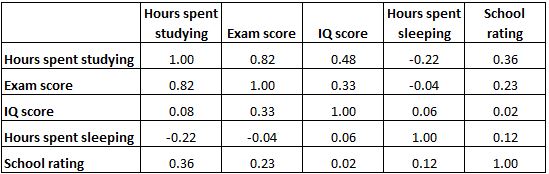
Each cell in the table shows the correlation between two specific variables. For example, the highlighted cell below shows that the correlation between “hours spent studying” and “exam score” is 0.82, which indicates that they’re strongly positively correlated. More hours spent studying is strongly related to higher exam scores.

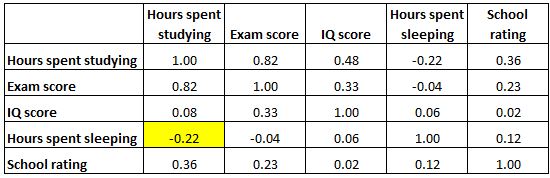
And the highlighted cell below shows that the correlation between “hours spent studying” and “hours spent sleeping” is -0.22, which indicates that they’re weakly negatively correlated. More hours spent studying is associated with less hours spent sleeping.
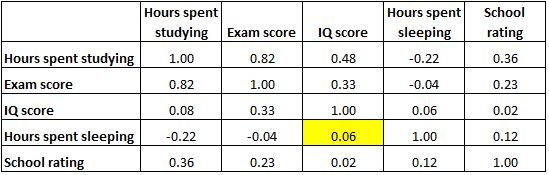
And the highlighted cell below shows that the correlation between “hours spent sleeping” and “IQ score” is 0.06, which indicates that they’re basically not correlated. There is very little association between the number of hours a student sleeps and their IQ score.
Also notice that the correlation coefficients along the diagonal of the table are all equal to 1 because each variable is perfectly correlated with itself. These cells aren’t useful for interpretation.

Variations of the Correlation Matrix
Notice that a correlation matrix is perfectly symmetrical. For example, the top right cell shows the exact same value as the bottom left cell:
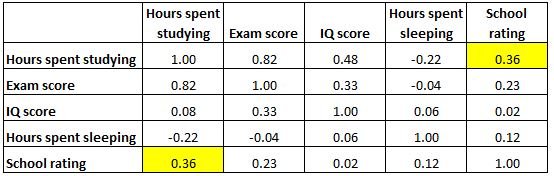
This is because both cells are measuring the correlation between “hours spent studying” and “school rating.”
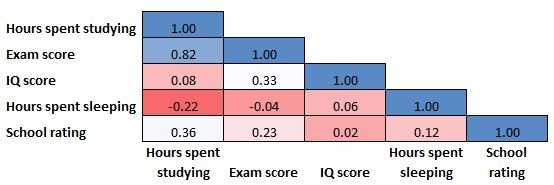
Because a correlation matrix is symmetrical, half of the correlation coefficients shown in the matrix are redundant and unnecessary. Thus, sometimes only half of the correlation matrix will be displayed:
And sometimes a correlation matrix will be colored in like a heat map to make the correlation coefficients even easier to read:
When to Use a Correlation Matrix
In practice, a correlation matrix is commonly used for three reasons:
1. A correlation matrix conveniently summarizes a dataset.
A correlation matrix is a simple way to summarize the correlations between all variables in a dataset. For example, suppose we have the following dataset that has the following information for 1,000 students:
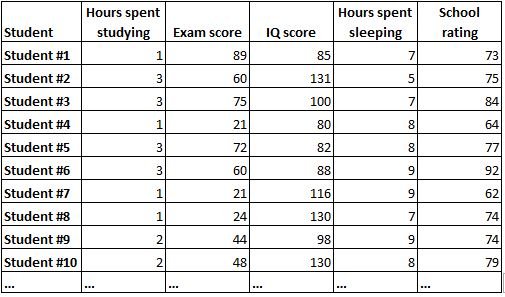
It would be very difficult to understand the relationship between each variable by simply staring at the raw data. Fortunately, a correlation matrix can help us quickly understand the correlations between each pair of variables.
2. A correlation matrix serves as a diagnostic for regression.
One key assumption of multiple linear regression is that no independent variable in the model is highly correlated with another variable in the model.
When two independent variables are highly correlated, this results in a problem known as multicollinearity and it can make it hard to interpret the results of the regression.
One of the easiest ways to detect a potential multicollinearity problem is to look at a correlation matrix and visually check whether any of the variables are highly correlated with each other.
3. A correlation matrix can be used as an input in other analyses.
A correlation matrix is used as an input for other complex analyses such as exploratory factor analysis and structural equation models.
Additional Resources
The following tutorials explain how to create a correlation matrix using various statistical software:
How to Create a Correlation Matrix in Excel
How to Create a Correlation Matrix in SPSS
How to Create a Correlation Matrix in Stata
How to Create a Correlation Matrix in Python
How to Create a Correlation Matrix in Matlab