JIRA Dashboard
When you log in to Jira, the first screen that will appear is Dashboard. The Dashboard can only be customized by the Admin, and based on the roles, an admin can access to Jira.
An admin can even change the color and the Jira logo.
You can create multiple dashboards that help you to organize your projects, assignments, and achievements in different charts.
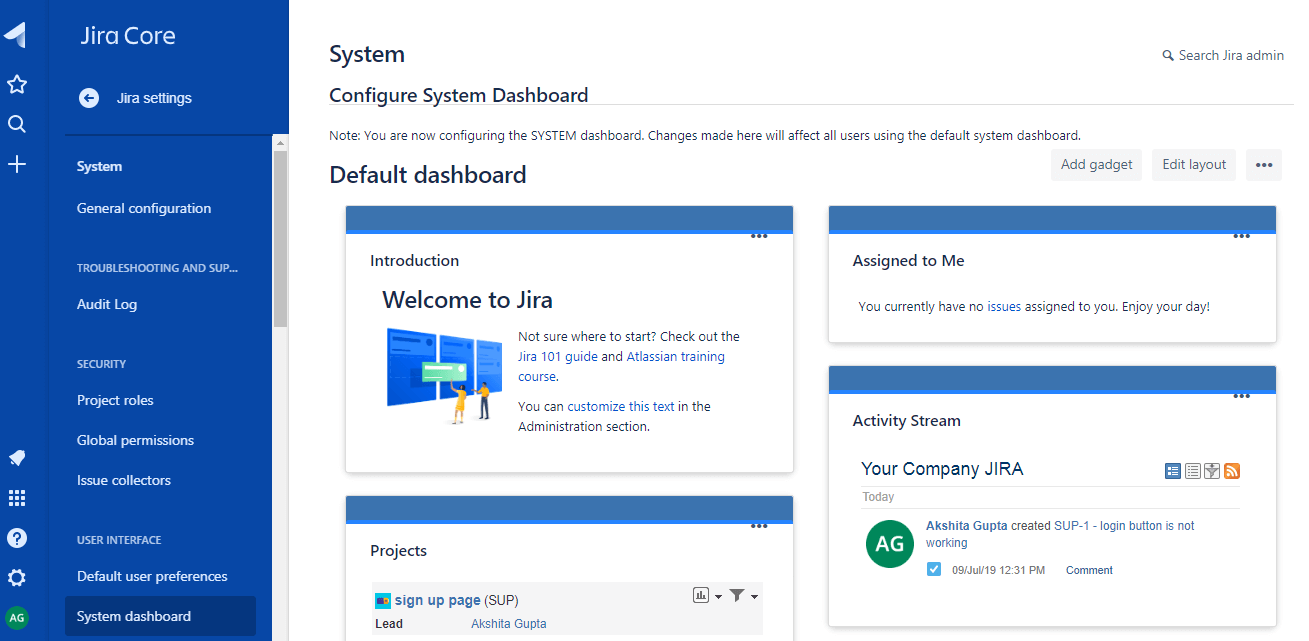
Default Dashboard
You can add the gadgets in a default dashboard as well as you can configure the default dashboard. The layout of the dashboard can also be configured, such as a number of columns. All the changes made to the default dashboard will also reflect the changes in the dashboard of the users that are currently using the default dashboard. For example, the Administration gadget exists in the Default dashboard, but it is visible to only admin.
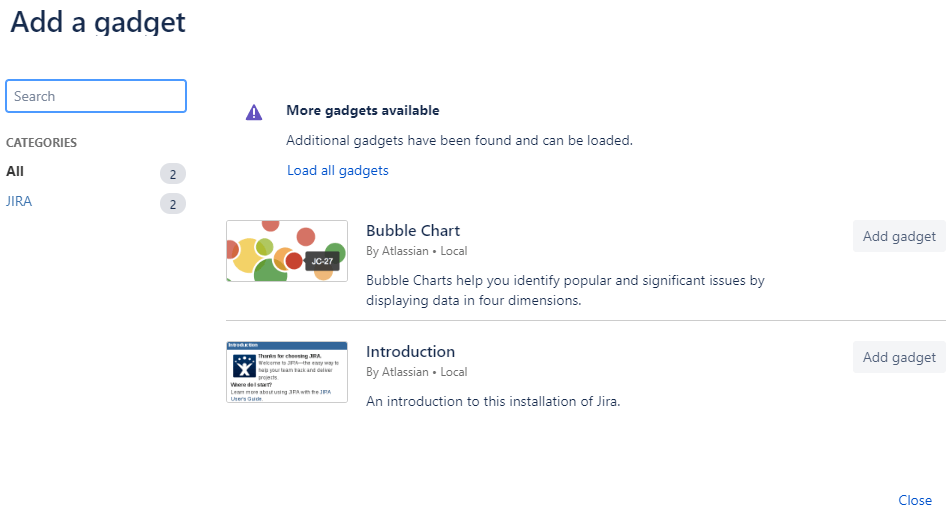
Following are the steps which can be used to add the gadget in default dashboard:
- Login to the Jira website.
- Click on the Add gadget link.
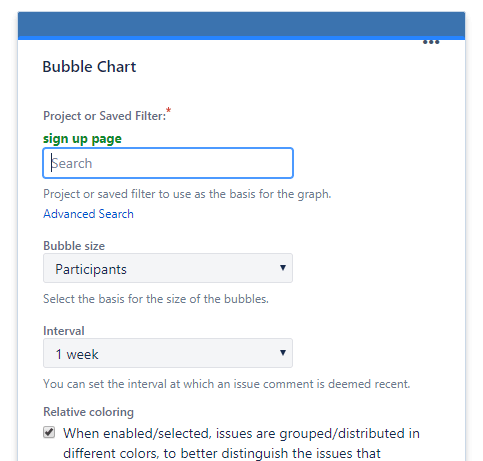
- After adding the gadget, the gadget is added in your dashboard and then click on the Save button.
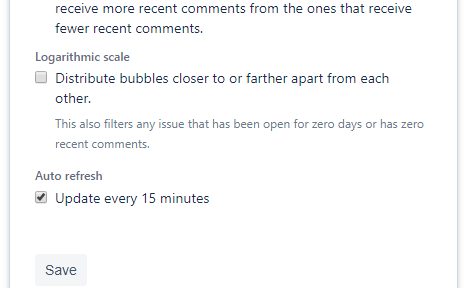
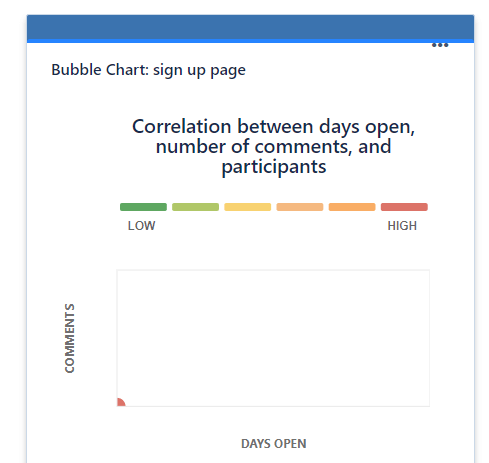
- When you save the gadget, then the bubble chart is created, which is shown below:
Create a Dashboard
The following are the steps to create a dashboard:
- Click on the ‘…’ button.
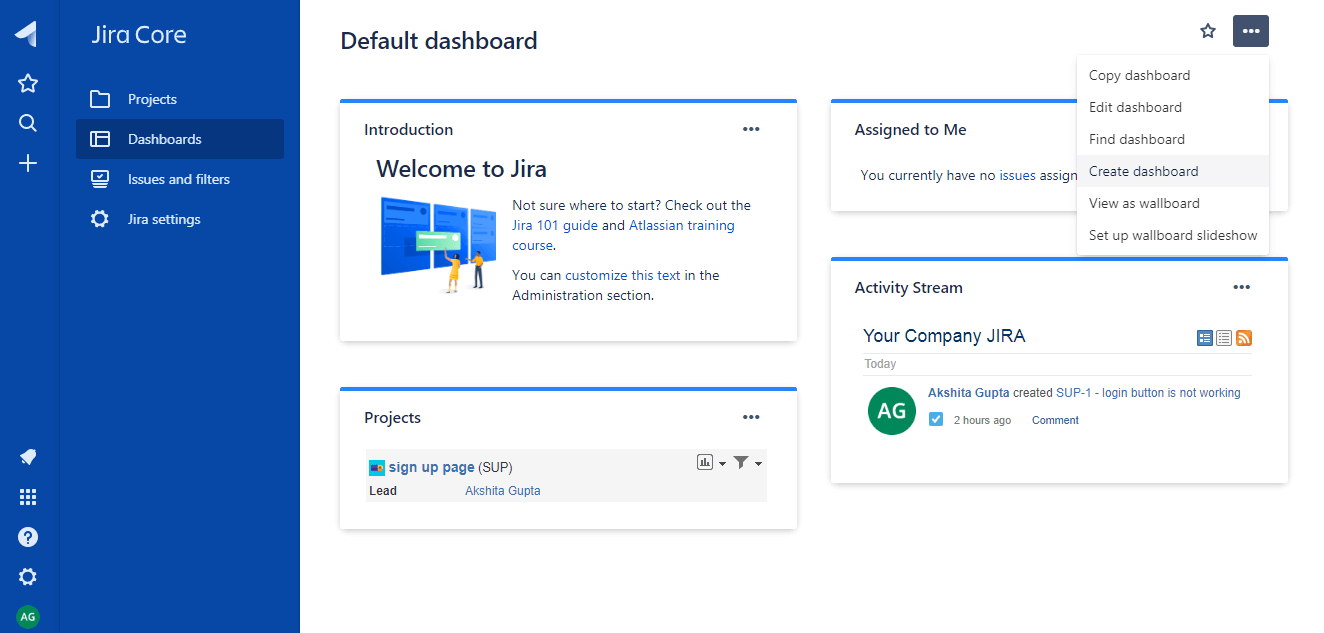
- Click on the Create dashboard from the drop-down menu of “…”. On clicking on the Create dashboard, the screen appears, which is shown below:
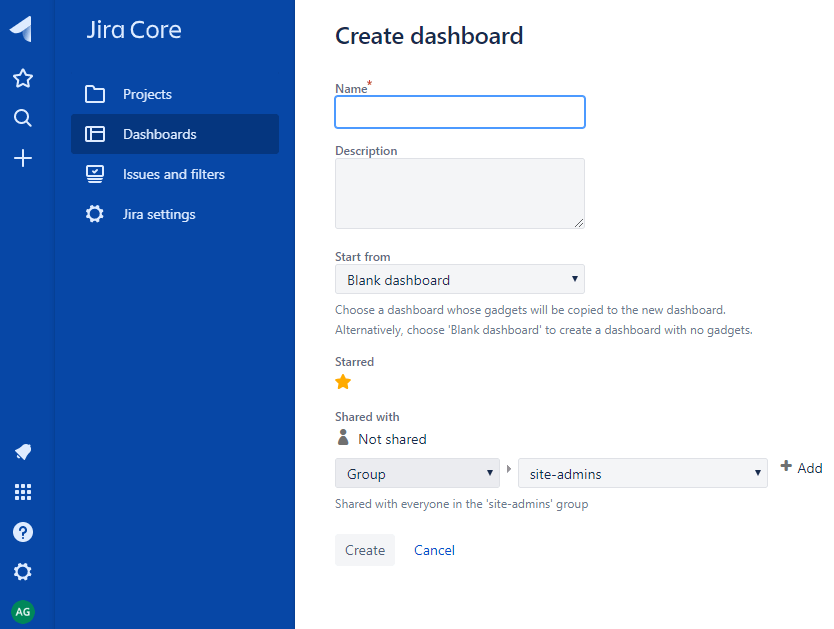
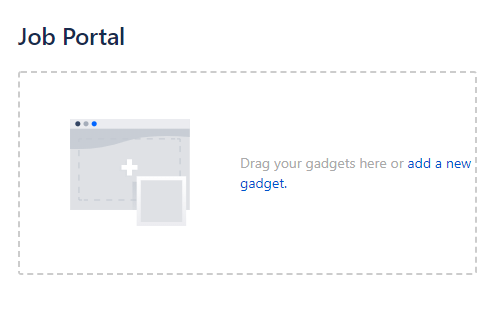
- Enter the details of the dashboard such as Name of the dashboard, description, etc and then click on the create button. Suppose I provide the name of the dashboard as Job Portal. The below screen shows that the dashboard has been created:
Note: We can also edit the Dashboard by clicking on the ‘…’ button and then click on the Edit Dashboard.