When using classification models in machine learning, two metrics we often use to assess the quality of the model are precision and recall.
Precision: Correct positive predictions relative to total positive predictions.
This is calculated as:
- Precision = True Positives / (True Positives + False Positives)
Recall: Correct positive predictions relative to total actual positives
This is calculated as:
- Recall = True Positives / (True Positives + False Negatives)
To visualize the precision and recall for a certain model, we can create a precision-recall curve. This curve shows the tradeoff between precision and recall for different thresholds.
The following step-by-step example shows how to create a precision-recall curve for a logistic regression model in Python.
Step 1: Import Packages
First, we’ll import the necessary packages:
from sklearn import datasets
from sklearn.model_selection import train_test_split
from sklearn.linear_model import LogisticRegression
from sklearn.metrics import precision_recall_curve
import matplotlib.pyplot as plt
Step 2: Fit the Logistic Regression Model
Next, we’ll create a dataset and fit a logistic regression model to it:
#create dataset with 5 predictor variables
X, y = datasets.make_classification(n_samples=1000,
                                    n_features=4,
                                    n_informative=3,
                                    n_redundant=1,
                                    random_state=0)

#split dataset into training and testing set
X_train, X_test, y_train, y_test = train_test_split(X, y, test_size=.3,random_state=0)

#fit logistic regression model to dataset
classifier = LogisticRegression()
classifier.fit(X_train, y_train)

#use logistic regression model to make predictions
y_score = classifier.predict_proba(X_test)[:, 1]
Step 3: Create the Precision-Recall Curve
Next, we’ll calculate the precision and recall of the model and create a precision-recall curve:
#calculate precision and recall
precision, recall, thresholds = precision_recall_curve(y_test, y_score)
#create precision recall curve
fig, ax = plt.subplots()
ax.plot(recall, precision, color='purple')
#add axis labels to plot
ax.set_title('Precision-Recall Curve')
ax.set_ylabel('Precision')
ax.set_xlabel('Recall')
#display plot
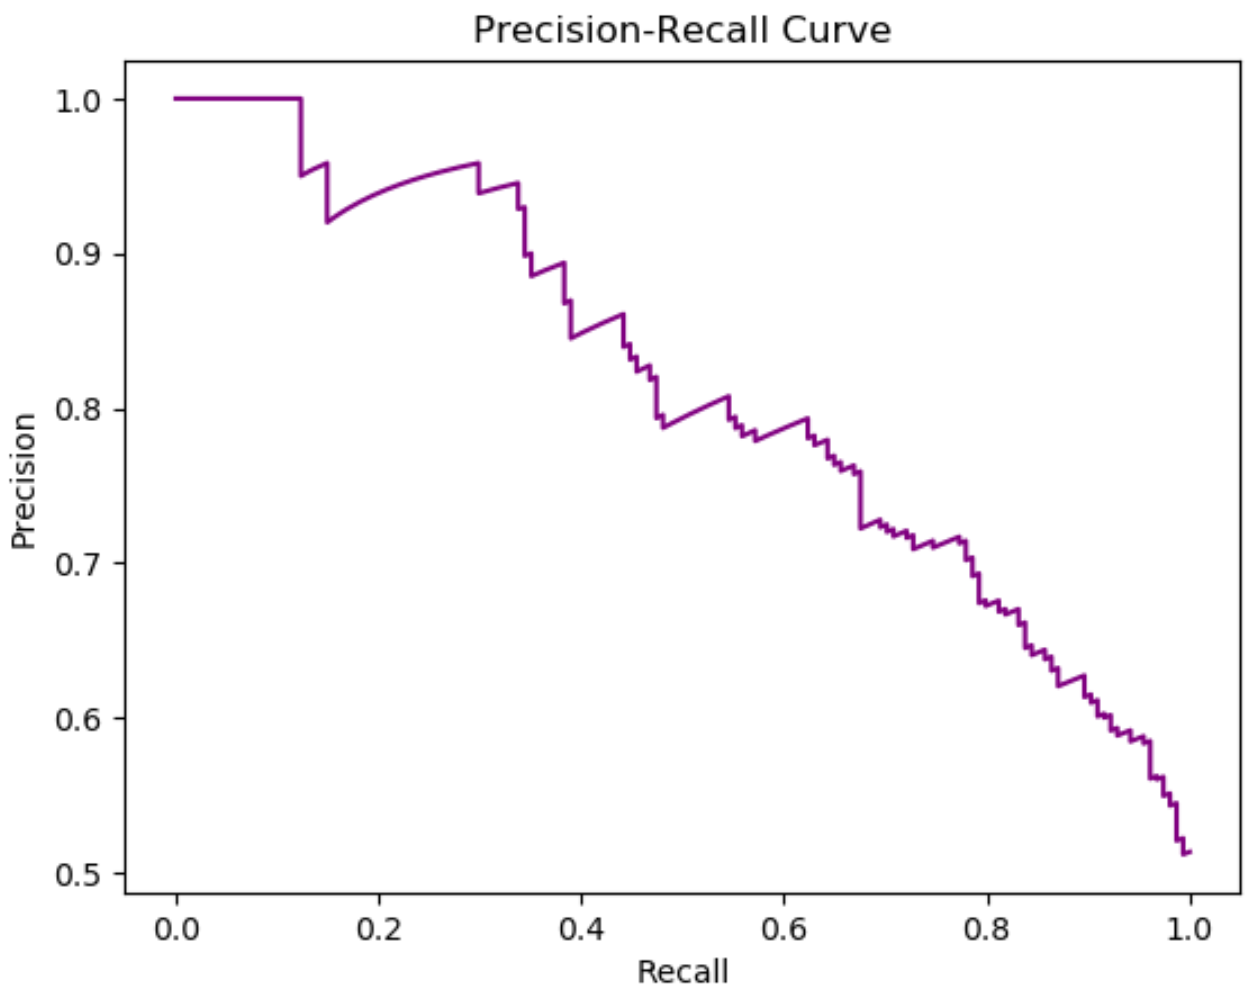
plt.show()
The x-axis shows the recall and the y-axis shows the precision for various thresholds.
Notice that as recall increases, precision decreases.
This represents the tradeoff between the two metrics. To increase the recall of our model, the precision must decrease and vice versa.
Additional Resources
How to Perform Logistic Regression in Python
How to Create a Confusion Matrix in Python
How to Interpret a ROC Curve (With Examples)