What is Noise in Data Mining?
Noisy data are data with a large amount of additional meaningless information called noise. This includes data corruption, and the term is often used as a synonym for corrupt data. It also includes any data that a user system cannot understand and interpret correctly. Many systems, for example, cannot use unstructured text. Noisy data can adversely affect the results of any data analysis and skew conclusions if not handled properly. Statistical analysis is sometimes used to weed the noise out of noisy data.
Noisy data are data that is corrupted, distorted, or has a low Signal-to-Noise Ratio. Improper procedures (or improperly-documented procedures) to subtract out the noise in data can lead to a false sense of accuracy or false conclusions.
Data = true signal + noise
Noisy data unnecessarily increases the amount of storage space required and can adversely affect any data mining analysis results. Statistical analysis can use information from historical data to weed out noisy data and facilitate data mining.
Noisy data can be caused by hardware failures, programming errors, and gibberish input from speech or optical character recognition (OCR) programs. Spelling errors, industry abbreviations, and slang can also impede machine reading.
Noise is an unavoidable problem that affects the data collection and preparation processes in Data Mining applications, where errors commonly occur. Noise has two main sources, such as:
- Implicit errors are introduced by measurement tools, such as different types of sensors.
- And random errors are introduced by batch processes or experts when the data are gathered, such as in a document digitalization process.
Sources of Noise
Differences in real-world measured data from the true values come from multiple factors affecting the measurement.
Random noise is often a large component of the noise in data. Random noise in a signal is measured as the Signal-to-Noise Ratio. Random noise contains almost equal amounts of a wide range of frequencies and is called white noise (as colors of light combine to make white). Random noise is an unavoidable problem. It affects the data collection and data preparation processes, where errors commonly occur. Noise has two main sources:
- Errors introduced by measurement tools,
- And random errors are introduced by processing or experts when the data is gathered.
Improper filtering can add noise if the filtered signal is treated as a directly measured signal. For example, Convolution-type digital filters such as a moving average can have side effects such as lags or truncation of peaks. Differentiating digital filters amplify random noise in the original data.
Outlier data are data that appear to not belong in the data set. It can be caused by human error such as transposing numerals, mislabeling, programming bugs, etc. If valid data is identified as an outlier and is mistakenly removed, that also corrupts results. If actual outliers are not removed from the data set, they corrupt the results to a small or large degree, depending on circumstances.
Fraud: Individuals may deliberately skew data to influence the results toward a desired conclusion. Data that looks good with few outliers reflects well on the individual collecting it, and so there may be incentive to remove more data as outliers or make the data look smoother than it is.
Types of Noise
A large number of components determine the quality of a dataset. Among them, the class labels and the attribute values directly influence the quality of a classification dataset. The quality of the class labels refers to whether the class of each example is correctly assigned; otherwise, the quality of the attributes refers to their capability of properly characterizing the examples for classification purposes if noise affects attribute values, this capability of characterization and, therefore, the quality of the attributes is reduced. Based on these two information sources, two types of noise can be distinguished in a given dataset.
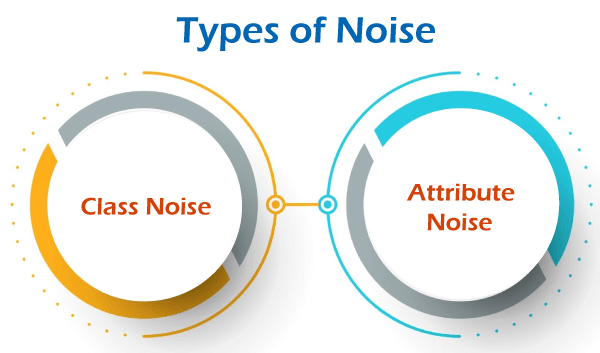
1. Class Noise (label noise)
This occurs when an example is incorrectly labeled. Class noise can be attributed to several causes, such as subjectivity during the labeling process, data entry errors, or inadequate information used to label each example. Class noise is further divided into two types, such as:
- Contradictory examples: Duplicate examples have different class labels. In the figure above, the two examples (0.25, red, class = positive) and (0.25, red, class = negative) are contradictory examples since they have the same attribute values and a different class.
- Misclassifications examples: Examples that are labeled as a class different from the real one. The figure placed above the example (0.99, green, class = negative) is a mislabeled example since its class label is wrong, and it would be “positive”.
2. Attribute Noise
This refers to corruption in the values of one or more attributes. Examples of attribute noise are:
- Erroneous attribute values: In the figure placed above, the example (1.02, green, class = positive) has its first attribute with noise since it has the wrong value.
- Missing or unknown attribute values: In the figure placed above, the example (2.05, ? class = negative) has attribute noise since we do not know the value of the second attribute.
- Incomplete attributes or do not care values: In the figure placed above, the example (=, green, class = positive) has attribute noise since the value of the first attribute does not affect the rest of the values of the example, including the class of the example.
Considering class and attribute noise as corruptions of the class labels and attribute values, respectively, is common in real-world data. Because of this, these types of noise have also been considered in many works in the literature. For instance, the authors reached a series of interesting conclusions, showing that attribute noise is more harmful than class noise or that eliminating or correcting examples in datasets with class and attribute noise may improve classifier performance. They also showed that attribute noise is more harmful in those attributes highly correlated with the class labels. The authors checked the robustness of methods from different paradigms, such as probabilistic classifiers, decision trees, and instance-based learners or support vector machines, studying the possible causes of their behaviors.
Simulating the Noise of Real World Datasets
Checking the effect of noisy data on the performance of classifier learning algorithms is necessary to improve their reliability and has motivated the study of how to generate and introduce noise into the data. Three main characteristics can characterize noise generation:
- The place where the noise is introduced. Noise may affect the input attributes or the output class, impairing the learning process and the resulting model.
- The noise distribution. How the noise is present can be, for example, uniform or Gaussian.
- The magnitude of generated noise values. The extent to which the noise affects the dataset can be relative to each data value of each attribute or relative to the minimum, maximum, and standard deviation for each attribute.
The initial amount and type of noise present in real-world datasets are unknown. Therefore, no assumptions about the base noise type and level can be made. For this reason, these datasets are considered noise-free, in the sense that no recognizable noise has been inducted into them. To control the amount of noise in each dataset and check how it affects the classifiers, noise is introduced into each dataset in a supervised manner in the literature.
The two types of noise considered, class and attribute noise, have been modeled using four different noise schemes in the literature; in such a way, the presence of a noise level x% of those types of noise will allow one to simulate the behavior of the classifiers in these scenarios:
- Class noise usually occurs on the boundaries of the classes, where the examples may have similar characteristics – although it can occur in any other area of the domain. Class noise is introduced in the literature using a uniform class noise scheme (randomly corrupting the class labels of the examples) and a pair-wise class noise scheme (labeling examples of the majority class with the second majority class). Considering these two schemes, noise affects any pair of classes, and only the two majority classes are simulated.
- Uniform class noise: x% of the examples are corrupted. The class labels of these examples are randomly replaced by another one from the other classes.
- Pair-wise class noise: Let X be the majority class and Y the second majority class. An example with the label X has a probability of x/100 of being incorrectly labeled as Y.
- Attribute noise can proceed from several sources, such as transmission constraints, sensor device faults, sampling irregularities, and transcription errors. The erroneous attribute values can be totally unpredictable, i.e., random, or imply a low variation for the correct value. We use the uniform attribute noise scheme and the Gaussian attribute noise scheme to simulate each one of the possibilities, respectively. We introduce attribute noise under the hypothesis that interactions between attributes are weak; consequently, the noise introduced into each attribute has a low correlation with the noise introduced into the rest.
- Uniform attribute noise: x% of the values of each attribute in the dataset are corrupted. To corrupt each attribute Ai, x% of the examples in the data set are chosen, and their Ai value is assigned a random value from the domain Di of the attribute Ai. A uniform distribution is used either for numerical or nominal attributes.
- Gaussian attribute noise: This scheme is similar to the uniform attribute noise, but in this case, the Ai values are corrupted, adding a random value to them following a Gaussian distribution of mean = 0 and standard deviation = (max-min)/5, being max and min the limits of the attribute domain. Nominal attributes are treated as in the case of the uniform attribute noise.
How to Manage Noisy Data?
Removing noise from a data set is termed data smoothing. The following ways can be used for Smoothing:
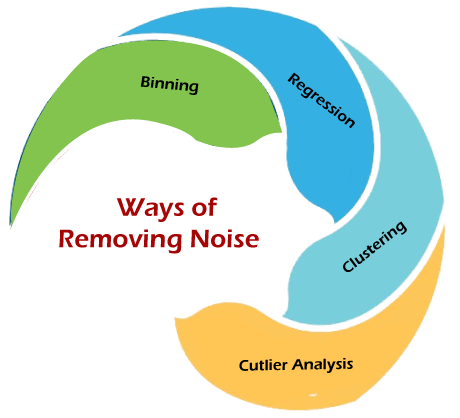
1. Binning
Binning is a technique where we sort the data and then partition the data into equal frequency bins. Then you may either replace the noisy data with the bin mean bin median or the bin boundary. This method is to smooth or handle noisy data. First, the data is sorted then, and then the sorted values are separated and stored in the form of bins. There are three methods for smoothing data in the bin.
- Smoothing by bin mean method: In this method, the values in the bin are replaced by the mean value of the bin.
- Smoothing by bin median: In this method, the values in the bin are replaced by the median value.
- Smoothing by bin boundary: In this method, the using minimum and maximum values of the bin values are taken, and the closest boundary value replaces the values.
2. Regression
This is used to smooth the data and help handle data when unnecessary data is present. For the analysis, purpose regression helps decide the suitable variable. Linear regression refers to finding the best line to fit between two variables so that one can be used to predict the other. Multiple linear regression involves more than two variables. Using regression to find a mathematical equation to fit into the data helps to smooth out the noise.
3. Clustering
This is used for finding the outliers and also in grouping the data. Clustering is generally used in unsupervised learning.
4. Outlier Analysis
Outliers may be detected by clustering, where similar or close values are organized into the same groups or clusters. Thus, values that fall far apart from the cluster may be considered noise or outliers. Outliers are extreme values that deviate from other observations on data. They may indicate variability in measurement, experimental errors, or novelty. In other words, an outlier is an observation that diverges from an overall pattern on a sample. Outliers can be the following kinds, such as:
- Univariate outliers can be found when looking at a distribution of values in a single feature space.
- Multivariate outliers can be found in an n-dimensional space (of n-features). Looking at distributions in n-dimensional spaces can be very difficult for the human brain. That is why we need to train a model to do it for us.
- Point outliers are single data points that lay far from the rest of the distribution.
- Contextual outliers can be noise in data, such as punctuation symbols when realizing text analysis or background noise signal when doing speech recognition.
- Collective outliers can be subsets of novelties in data, such as a signal that may indicate the discovery of new phenomena.
Data cleaning is an important stage. After all, your results are based on your data. The more the dirt, the more inaccurate your results would prove.
Data Cleaning eliminates noise and missing values. Data Cleaning is just the first of the many steps for data pre-processing. In addition to the above, data pre-processing includes Aggregation, Feature Construction, Normalization, Discretization, Concept hierarchy generation, which mostly deal with making the data consistent. Data pre-processing, at times, also comprises 90% of the entire process.