82
MATLAB hist()
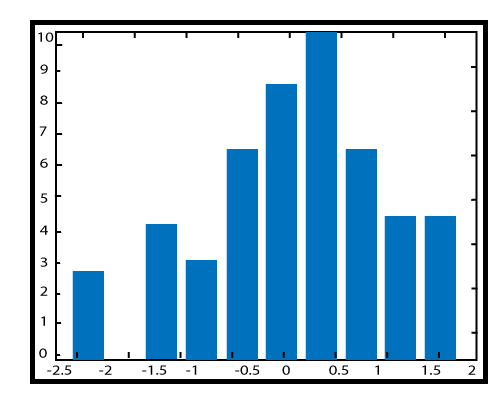
A histogram is a plot presenting the distribution of values within a data set. To develop a histogram, the range of values within the data set is split into evenly spaced bins, and the number of data values falling into each bin is determined.
Syntax
Example
Output:
Next TopicMATLAB stem()