80
MATLAB loglog()
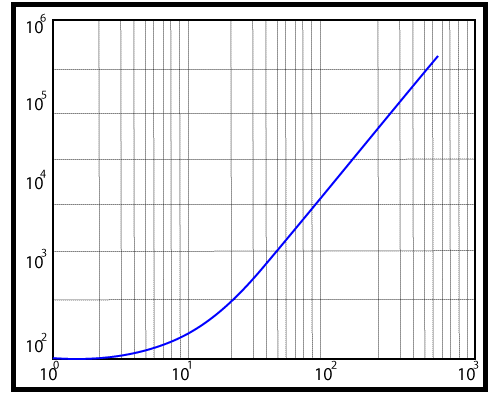
It generates a plot of the vectors x and y, using a logarithmic scale for both x and y-axis.
Syntax
Example
Create a plot using logarithmic scales for both the x-axis and the y-axis.
Output:
Next TopicMATLAB Polar Plots()