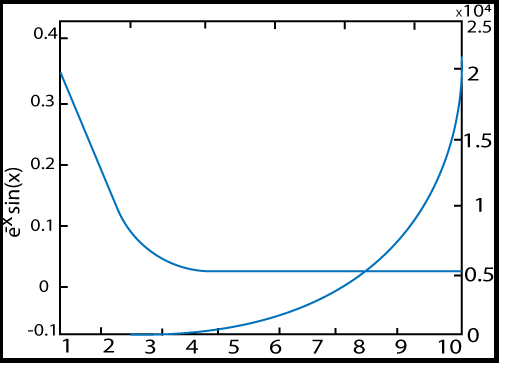
Matlab TutorialPopular Tutorials MATLAB 2D plotyy() by Online Tutorials Library July 14, 2022 79 MATLAB plotyy() It creates graphs with y-axes on both the left and right sides. Syntax plotyy(X1,Y1,X2,Y2) // It plots X1 versus Y1 with y-axis label on the left and plot X2 versus Y2 with y-axis labeling on the right. plotyy(X1,Y1,X2,Y2,’function’) // It uses the plotting function specified by the string ‘function’ instead of plot to produce each graph. ‘function’ can be plot, semilogx, semilogy,stem,loglog etc. plotyy(X1, Y1,X2,Y2,’function1′,’function2′) // It uses function1(X1, Y1) to plot the information for the left-axis and function2(X2,Y2) to plot the information for the right axis. [AX, H1, H2] = plotyy(…) // It returns the handles of the two axes generated in AX and the handle of the graphics objects from each plots in H1 and H2. AX (1) is a left axes and AX (2) is a right axes. Example y_1=e^-x sinx,0≤t≤10 y_2=e^x x= 1:1:10; y1=exp(-x).*sin(x); y2=exp(x); Ax=plotyy(x, y1, x, y2); hy1=get(Ax(1),’ylabel’); hy2= get(Ax(2),’ylabel’); set(hy1,’string’,’e^-x sin(x)’); set(hy2,’string’,’ e^ x’); Output: Next TopicMATLAB area() computer programming languagedownload matlabhow to download matlabhow to install matlabinstall matlabmatlabmatlab 2-d and 3-d plotsmatlab commandsmatlab data typesmatlab desktop fundamentalsmatlab downloadingmatlab installationmatlab introductionmatlab loopsmatlab matrices and arraysmatlab numbersmatlab object-oriented programmingmatlab operatorsmatlab platformmatlab programming and scriptsmatlab programming fundamentalsmatlab requirementsmatlab stringsmatlab syntaxmatlab tutorialmatlab variablesmatlab vectors Share 0 FacebookTwitterPinterestEmail previous post Area of trapezoid next post Client-side vs server-side routing in MEAN Stack You may also like C++ String operator+=() function C++ Vector pop_back() function LCD Interfacing with AVR C++ String front() function C++ Vector end() function Vigenere Cipher