99
MATLAB Sine Wave Plot
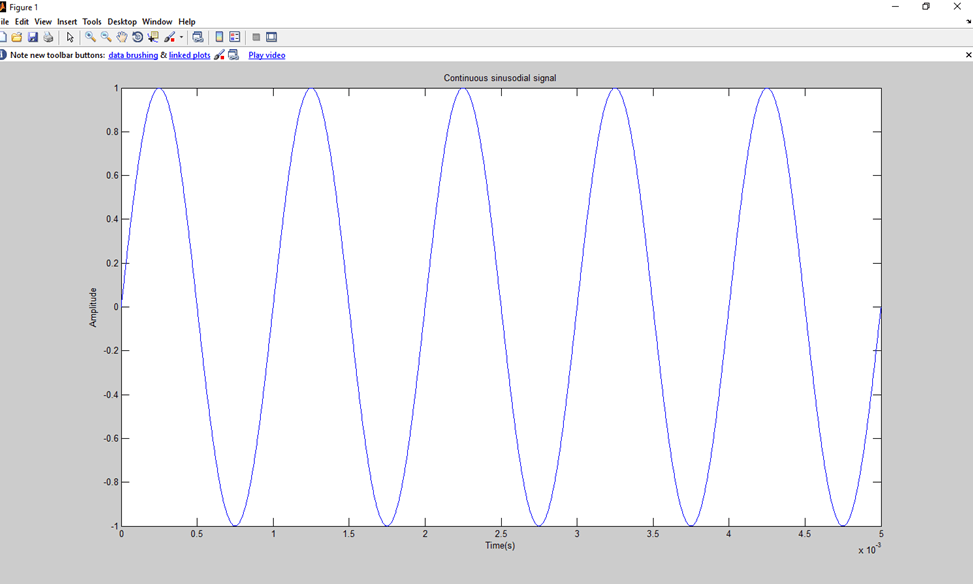
Objective: To plot a sine wave of the frequency of 1KHz.
Example: Let’s generate a simple continuous like sinusoidal signal with frequency FM=1KHz. In order to make it occur as a repetitive signal when plotting, a sampling rate of fs=500KHz is used.
Output:
Next Topic#