R Poisson Regression
The Poisson Regression model is used for modeling events where the outcomes are counts. Count data is a discrete data with non-negative integer values that count things, such as the number of people in line at the grocery store, or the number of times an event occurs during the given timeframe.
We can also define the count data as the rate data. So that it can express the number of times an event occurs within the timeframe as a raw count or as a rate. Poisson regression allows us to determine which explanatory variable (x values) influence a given response variable (y value, count, or a rate).
For example, poisson regression can be implemented by a grocery store to understand better, and predict the number of people in a row.
There is the following general mathematical equation for poisson regression:
Here,
| S.No | Parameter | Description |
|---|---|---|
| 1. | y | It is the response variable. |
| 2. | a and b | These are the numeric coefficients. |
| 3. | x | x is the predictor variable. |
The poisson regression model is created with the help of the familiar function glm().
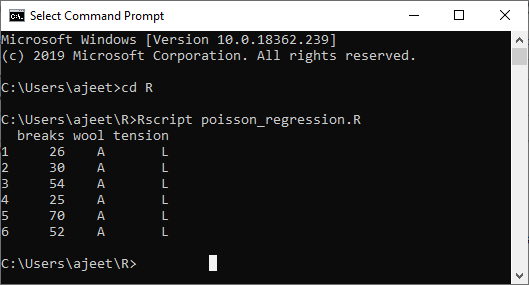
Let’s see an example in which we create the poisson regression model using glm() function. In this example, we have considered an in-built dataset “wrapbreaks” that describe the tension(low, medium, or high), and the effect of wool type(A and B) on the number of wrap breaks per loom. We will consider wool “type” and “tension”as the predictor variables, and “breaks” is taken as the response variable.
Example
Output:
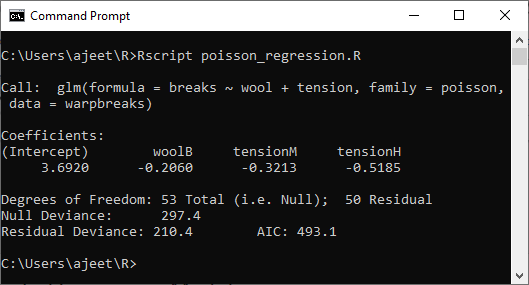
Now, we will create the regression model with the help of the glm() function as:
Output:
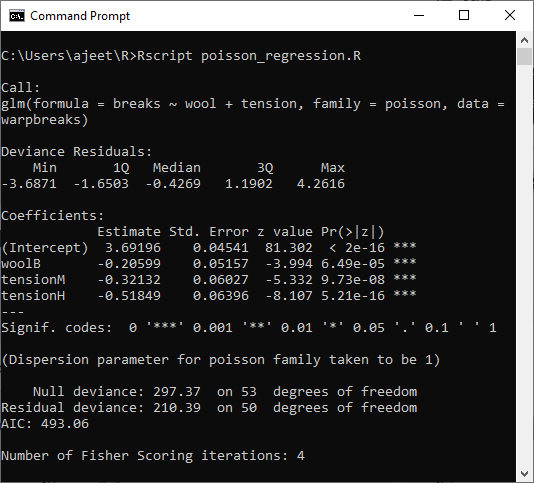
Now, let’s use summary() function to find the summary of the model for data analysis.
Output: