You can use the following methods to control the colors of seaborn boxplots:
Method 1: Use One Specific Color
sns.boxplot(x='group_var', y='values_var', data=df, color='red')
Method 2: Use a List of Specific Colors
my_colors = {'group1': 'purple', 'group2': 'pink', 'group3': 'gold'}

sns.boxplot(x='group_var', y='values_var', data=df, palette=my_colors)
Method 3: Highlight a Specific Group
my_colors = {x: 'pink' if x == 'group2' else 'grey' for x in df.group.unique()}

sns.boxplot(x='group_var', y='values_var', data=df, palette=my_colors)
Method 4: Use a Seaborn Color Palette
sns.boxplot(x='group_var', y='values_var', data=df, palette='Greens')
The following examples show how to use each method in practice with the following pandas DataFrame that shows the points scored by basketball players on three different teams:
import pandas as pd

#create DataFrame
df = pd.DataFrame({'team': ['A', 'A', 'A', 'A', 'A', 'B', 'B', 'B',
                            'B', 'B', 'C', 'C', 'C', 'C', 'C'],
                   'points': [3, 4, 6, 8, 9, 10, 13, 16, 18, 20, 8, 9, 12, 13, 15]})

#view head of DataFrame
print(df.head())

  team  points
0    A       3
1    A       4
2    A       6
3    A       8
4    A       9
Example 1: Use One Specific Color
The following code shows how to create boxplots to visualize the distribution of points for each team and use the color red for each boxplot:
import seaborn as sns

#create boxplots and use red for each box
sns.boxplot(x='team', y='points', data=df, color='red')

Notice that each boxplot has a color of red.
Example 2: Use a List of Specific Colors
The following code shows how to create boxplots to visualize the distribution of points for each team and use the colors purple, pink and gold:
import seaborn as sns

#specify colors to use
my_colors = {'A': 'purple', 'B': 'pink', 'C': 'gold'}

#create boxplots using specific colors for each team
sns.boxplot(x='team', y='points', data=df, palette=my_colors)
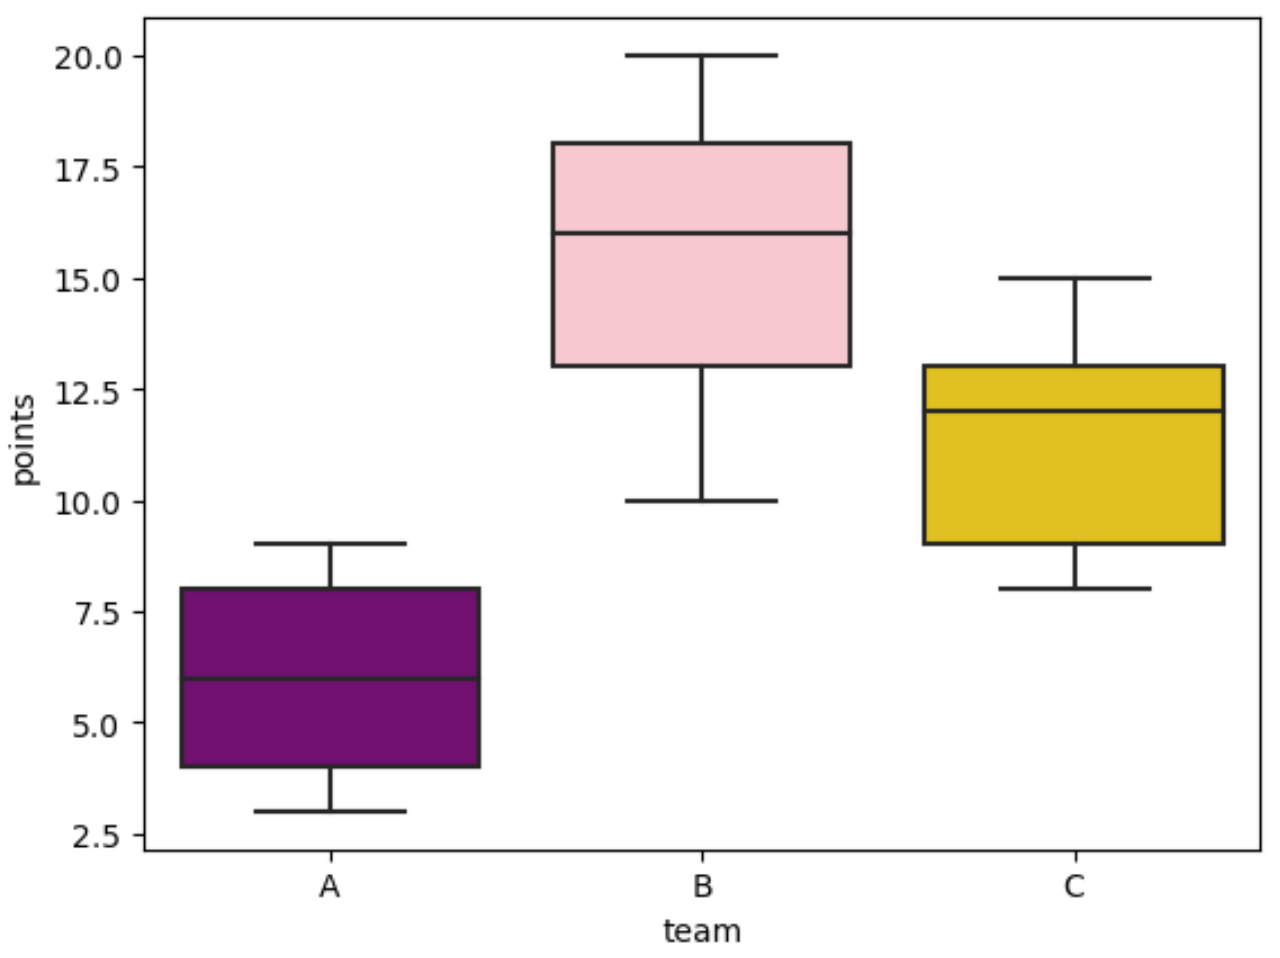
Notice that each boxplot has the color that we specified in the dictionary called my_colors.
Example 3: Highlight a Specific Group
The following code shows how to highlight the boxplot for team B in pink and letting every other boxplot be grey:
import seaborn as sns

#specify one group to highlight in pink
my_colors = {x: 'pink' if x == 'B' else 'grey' for x in df.team.unique()}

#create boxplots and highlight team B
sns.boxplot(x='team', y='points', data=df, palette=my_colors)
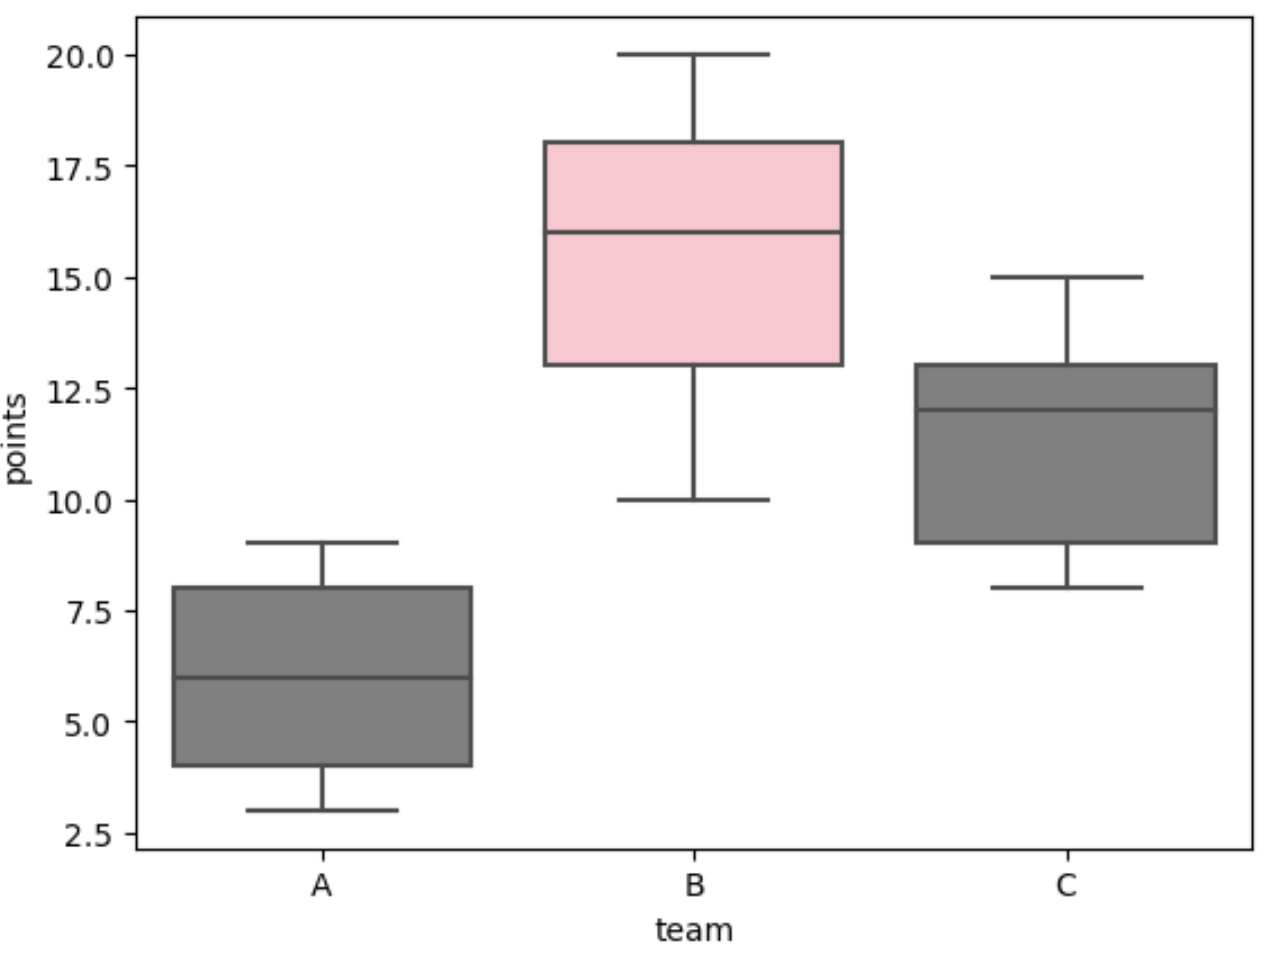
Notice that team B is highlighted in pink and all other boxplots are grey, just as we specified in my_colors.
Example 4: Use a Seaborn Color Palette
The following code shows how to use the ‘Greens’ seaborn color palette to use various shades of green for each box in the boxplot:
import seaborn as sns

#create boxplots and use 'Greens' color palette
sns.boxplot(x='team', y='points', data=df, palette='Greens')

Notice that each boxplot is a unique shade of green.
Note: You can find a complete list of Seaborn color palettes here.
Additional Resources
The following tutorials explain how to perform other common functions in seaborn:
How to Remove Outliers from a Seaborn Boxplot
How to Create a Boxplot of Multiple Columns in Seaborn
How to Order Boxplots on x-axis in Seaborn